Introduction to Real-Time Chart-Trading

IMPORTANT NOTE: DO NOT USE ANY OF THE PROGRAMS PRESENTED HERE TO TRADE REAL MONEY. Most of the programs presented will only work with live data, execution reports, and market conditions. They will NOT work using the AmiBroker Bar Replay or the IB eDemo account.

Traditional Day-Trading by looking at TWS prices may still work for experienced traders who, probably over a period of many years, developed rapid interpretation skills. However, for less experienced traders graphical representations are much easier to interpret than spreadsheets or tables. Setting prices by clicking on your chart is much faster than entering prices in little windows. Trailing the price with your cursor is much faster than entering and modifying parameters in a GUI. All this is especially true when you are trading in real-time, where every second counts.

Posts in this category will introduce techniques that you can use to create your own custom designed Chart-Trading GUI. If you Google Chart-Trading you will find many examples of the many ways you can layout your personal interface. If you aim for maximum simplicity and automation you will end up with the most efficient GUI. Tentative topics that will be covered are:

1) Laying out buttons and controls (Param() Or Button())
2) House keeping functions (AutoTrading, CancelAll, CloseAll, etc.)
3) Automating setup for different trading methodologies (minimizing setup procedure)
4) Auto placement of orders
5) Auto Modification of Orders
6) Displaying order and system status
7) Performance reporting (Profits, Wins, etc.)

1 Star2 Stars3 Stars4 Stars5 Stars (6 votes, average: 4.17 out of 5)
Loading ... Loading ...

Button Rotate

A ButtonRotate function is like a ParamToggle() but with multiple states. The ButtonRotate function returns the label displayed on the button, and selects the next label each time you click the button. In the example below the ButtonRotate is used to select the next action, which can be Buy, Sell, Short, Cover, Cash, or Reverse. The end result of using this function is similar to using the ParamList() however it is much quicker to use. When the action is selected the order can be transmitted using the Transmit ButtonTrigger().The function returns the displayed label; sometimes the label can be used directly in PlaceOrder(), at other times you may have to use an if() comparison to know which action to perform. For debugging purposes the Title shows the returned values:

rotatebutton.png

The ButtonRotate() is listed below for discussion. There is no need to copy this because it is included in the Include file at the end of this post.

1
2
3
4
5
6
7
8
9
10
11
12
13
14
15
16
17
18
19
20
21
22
23
24
25
26
27
28
29
30
31
32
33
34
function ButtonRotate( LabelStr, BackColorStr, TextColorStr )
{
    global ColNumber, RowNumber, ColName, ColExpanded;
 
    if ( ColExpanded )
    {
        ColName = VarGetText( "ColName" );
        RowNumber = Nz( kStaticVarGet( "RowNumber" + ColName ) ) + 1;
        kStaticVarSet( "RowNumber" + ColName, RowNumber );
        Rotate = GetButtonClick( ColNumber, RowNumber );
        if ( Rotate OR IsNull( StaticVarGet("RotateInit"+ ColName + RowNumber ) ) )
        {
            RotateIndex = Nz( kStaticVarGet( "RotateIndex" + ColName + RowNumber ) );
            if ( StrExtract( LabelStr, RotateIndex + 1) != "" ) RotateIndex++;
            else RotateIndex = 0;
            kStaticVarSet( "RotateIndex" + ColName + RowNumber, RotateIndex );
 
            Label = StrExtract( LabelStr, RotateIndex );
 
            if ( StrExtract( BackColorStr, RotateIndex ) == "" ) BackColor = StrToNum( StrExtract( BackColorStr, 0 ) );
            else BackColor = StrToNum( StrExtract( BackColorStr, RotateIndex ) );
 
            if ( StrExtract( TextColorStr, RotateIndex ) == "" ) TextColor = StrToNum( StrExtract( TextColorStr, 0 ) );
            else TextColor = 	StrToNum( StrExtract( TextColorStr, RotateIndex ) );
 
            kStaticVarSetText( "Label" + ColName + RowNumber, Label );
            kStaticVarSet( "TextColor" + ColName + RowNumber, TextColor );
            kStaticVarSet( "BackColor" + ColName + RowNumber, BackColor );
				StaticVarSet("RotateInit"+ ColName + RowNumber, True);
        }
    }
    Label 	= kStaticVarGetText( "Label" + ColName + RowNumber);
    return Label;
}

Referring to the above code you’ll see the usual ColExpanded variable that determines whether this button will be displayed. A RotateInit var is used to detect whether the button has been initialized, i.e., whether is was assigned colors and text. Each time the function is called the RotateIndex incremented. This index is used to extract the proper label and color from the csv encoded options in the string argument for the function.

The code below demonstrates how the ButtonRotate is used. Note that for brevity I used digits to indicate colors. You can also use constants like ColorRed, ColorBlue, etc.

1
2
3
4
5
6
7
8
9
10
11
12
13
14
15
16
17
18
19
20
21
22
23
24
25
26
27
28
29
30
31
32
33
34
35
36
37
#include <ControlPanelInclude-004.afl>
 
global ColNumber;
RequestTimedRefresh(1);
ButtonHeight			= Param("Button Height",20,5,200,1); 
ButtonWidth 			= Param("Button Width",120,5,200,1); 
PanelYoffset 			= Param("Button Row Offset (px)",10,0,Status("pxheight"),1); 
PanelXoffset			= Param("Button Column Offset (px)",10,0,Status("pxwidth"),1); 
FontRatio   			= Param("Font: ButtonHeight ratio",2,1,20,0.1);
DoubleClickInterval	= Param("Double Click Max. Interval",330,1,1000,1);
 
ButtonColumnBegin( "1" );
ButtonHeader( "HEADER", colorBlue, colorBlue,colorWhite);
ButtonText( "TRADING ENABLED", colorYellow, colorBlue);
 
Action=ButtonRotate( "BUY,SELL,SHORT,COVER,CASH,REVERSE", "6,5,1,3,2,4", "2,3,4,5,6,1" );
Transmit = ButtonTrigger( "TRANSMIT", colorBrightGreen, colorRed, colorBlack);
ButtonColumnEnd( );
 
ClickCoordinates = Nz(StaticVarGet("ClickCoordinates"));
switch( ClickCoordinates )
	{
	case 101:
	// Perform Button task 101 here
	break;
	case 102:
	// Perform Button task 102 here
	break;
	// etc.
	}
 
Plot(C,"",1,128);
 
Title = "\n"+
"Button Coordinates: "+ClickCoordinates+"\n"+
"Action: "+Action+"\n"+
"Transmit: "+Transmit;

As always, here follows the revised Include file with the ButtonRotate() included.

1
2
3
4
5
6
7
8
9
10
11
12
13
14
15
16
17
18
19
20
21
22
23
24
25
26
27
28
29
30
31
32
33
34
35
36
37
38
39
40
41
42
43
44
45
46
47
48
49
50
51
52
53
54
55
56
57
58
59
60
61
62
63
64
65
66
67
68
69
70
71
72
73
74
75
76
77
78
79
80
81
82
83
84
85
86
87
88
89
90
91
92
93
94
95
96
97
98
99
100
101
102
103
104
105
106
107
108
109
110
111
112
113
114
115
116
117
118
119
120
121
122
123
124
125
126
127
128
129
130
131
132
133
134
135
136
137
138
139
140
141
142
143
144
145
146
147
148
149
150
151
152
153
154
155
156
157
158
159
160
161
162
163
164
165
166
167
168
169
170
171
172
173
174
175
176
177
178
179
180
181
182
183
184
185
186
187
188
189
// ControlPanelInclude-004.afl
procedure kStaticVarSet( SName, SValue ) 		
	{
	ChartID = GetChartID();
	InIndicator = Status("Action") == 1;
	if( InIndicator ) StaticVarSet(Sname+ChartID, Svalue); 
	}
 
function kStaticVarGet( SName ) 					
	{ 
	ChartID 	= GetChartID();
	Var = StaticVarGet(Sname+ChartID);
	return Var;
	}
 
procedure kStaticVarSetText( SName, SValue ) 	
	{ 
	ChartID 	= GetChartID();
	InIndicator = Status("Action") == 1;
	if( InIndicator ) StaticVarSetText(Sname+ChartID, Svalue); 
	}
 
function kStaticVarGetText( SName ) 				
	{ 
	ChartID = GetChartID();
	return StaticVarGetText(Sname+ChartID); 
	}
 
function NewColumn()
	{
	VarSet("ColNumber", 0);
	}
 
function GetButtonClick( ColNumber, RowNumber )
	{
	global PanelYoffset, PanelXoffset, ButtonHeight, ButtonWidth;
	LButtonDown = GetCursorMouseButtons() == 9;
	Click = False;
	if( LButtonDown )
		{
		ULButtonX 	= PanelXoffset + (ColNumber-1) * ButtonWidth;
		LRButtonX	= ULButtonX + ButtonWidth;
		ULButtonY 	= (RowNumber -1) * ButtonHeight + PanelYoffset;
		LRButtonY	= ULButtonY + ButtonHeight;
		MouseCoord 	= Nz(StaticVarGet("ClickCoordinates"));
		if( MouseCoord == 0 AND LButtonDown )
			{
			MousePx = GetCursorXPosition( 1 );
			MousePy = GetCursorYPosition( 1 );
			if( MousePx > ULButtonX AND MousePx < LRButtonX AND MousePy > ULButtonY AND MousePy < LRButtonY )
				{
				StaticVarSet("ClickCoordinates",ColNumber*100+RowNumber);
				Click = 1;
				}
			}
		}
	return Click;
	}
 
function ButtonColumnBegin( ColName ) 
	{
	global FontRatio, ColName, ColNumber, ButtonHeight, ButtonWidth, PanelXoffset, PanelYoffset, Colname;
	ColNumber = VarGet("ColNumber");
	if( IsEmpty( ColNumber ) ) 
		{
		VarSet("ColNumber",1);
		StaticVarSet("ClickCoordinates",0);
		}
	else VarSet("ColNumber", ++ColNumber);
	ColName = ColName+GetChartID();
	kStaticVarSet("RowNumber"+ColName, 0);
	VarSetText("ColName",ColName);
	GfxSetOverlayMode( 0 );
	GfxSelectFont( "Tahoma", ButtonHeight/FontRatio, 800 ); 
	GfxSelectPen( colorBlack ); 
	GfxSetBkMode( 1 );
	}
 
function ButtonHeader( Label, backColor1, BackColor2, TextColor)
	{
	global ColNumber, RowNumber, ColExpanded, Colname;
	RowNumber = Nz(kStaticVarGet("RowNumber"+ColName))+1;
	kStaticVarSet("RowNumber"+ColName, RowNumber);
	SingleClick = GetButtonClick( ColNumber, RowNumber );
	BackColor = backColor1;
	ColExpanded = Nz(kStaticVarGet(ColName+"ColExpanded"));
	if( SingleClick ) 
		{
		BackColor = backColor2; 
		ColExpanded = Nz(kStaticVarGet(ColName+"ColExpanded"));
		if( ColExpanded ) kStaticVarSet(ColName+"ColExpanded", False);
		else kStaticVarSet(ColName+"ColExpanded", True);
		}
	ColExpanded = Nz(kStaticVarGet(ColName+"ColExpanded"));
	kStaticVarSetText("Label"+ColName+RowNumber, Label);
	kStaticVarSet("TextColor"+ColName+RowNumber, TextColor);
	kStaticVarSet("BackColor"+ColName+RowNumber, backColor);
	}
 
function ButtonText( Label, backColor, TextColor)
	{
	global ColNumber, RowNumber, Colname;
	ColExpanded = Nz(kStaticVarGet(ColName+"ColExpanded"));
	if( ColExpanded )
		{
		ColName = VarGetText("ColName");
		RowNumber = Nz(kStaticVarGet("RowNumber"+ColName))+1;
		kStaticVarSet("RowNumber"+ColName, RowNumber);
		kStaticVarSetText("Label"+ColName+RowNumber, Label);
		kStaticVarSet("TextColor"+ColName+RowNumber, TextColor);
		kStaticVarSet("BackColor"+ColName+RowNumber, backColor);
		}
	}
 
function ButtonTrigger( Label, backColor1, BackColor2, TextColor)
	{
	global ColNumber, RowNumber, ColName;
	ColExpanded = Nz(kStaticVarGet(ColName+"ColExpanded"));
	if( ColExpanded )
		{
		ColName = VarGetText("ColName");
		RowNumber = Nz(kStaticVarGet("RowNumber"+ColName))+1;
		kStaticVarSet("RowNumber"+ColName, RowNumber);
		Trigger = GetButtonClick( ColNumber, RowNumber );
		if( Trigger ) BackColor = backColor2; else BackColor = backColor1;
		kStaticVarSetText("Label"+ColName+RowNumber, Label);
		kStaticVarSet("TextColor"+ColName+RowNumber, TextColor);
		kStaticVarSet("BackColor"+ColName+RowNumber, backColor);
		}
	else Trigger = 0;
	return Trigger;
	}
 
function ButtonRotate( LabelStr, BackColorStr, TextColorStr )
{
    global ColNumber, RowNumber, ColName, ColExpanded;
 
    if ( ColExpanded )
    {
        ColName = VarGetText( "ColName" );
        RowNumber = Nz( kStaticVarGet( "RowNumber" + ColName ) ) + 1;
        kStaticVarSet( "RowNumber" + ColName, RowNumber );
        Rotate = GetButtonClick( ColNumber, RowNumber );
        if ( Rotate OR IsNull( StaticVarGet("RotateInit"+ ColName + RowNumber ) ) )
        {
            RotateIndex = Nz( kStaticVarGet( "RotateIndex" + ColName + RowNumber ) );
            if ( StrExtract( LabelStr, RotateIndex + 1) != "" ) RotateIndex++;
            else RotateIndex = 0;
            kStaticVarSet( "RotateIndex" + ColName + RowNumber, RotateIndex );
 
            Label = StrExtract( LabelStr, RotateIndex );
 
            if ( StrExtract( BackColorStr, RotateIndex ) == "" ) BackColor = StrToNum( StrExtract( BackColorStr, 0 ) );
            else BackColor = StrToNum( StrExtract( BackColorStr, RotateIndex ) );
 
            if ( StrExtract( TextColorStr, RotateIndex ) == "" ) TextColor = StrToNum( StrExtract( TextColorStr, 0 ) );
            else TextColor = 	StrToNum( StrExtract( TextColorStr, RotateIndex ) );
 
            kStaticVarSetText( "Label" + ColName + RowNumber, Label );
            kStaticVarSet( "TextColor" + ColName + RowNumber, TextColor );
            kStaticVarSet( "BackColor" + ColName + RowNumber, BackColor );
				StaticVarSet("RotateInit"+ ColName + RowNumber, True);
        }
    }
    Label 	= kStaticVarGetText( "Label" + ColName + RowNumber);
    return Label;
}
 
 
function ButtonColumnEnd()
	{
	global ButtonHeight, ButtonWidth, PanelYoffset, PanelXoffset, ColNumber, RowNumber, ColName;
	ChartIDStr 	= NumToStr(GetChartID(),1.0,False);
	ULButtonX 		= PanelXoffset + (ColNumber-1) * ButtonWidth;
	LRButtonX		= ULButtonX + ButtonWidth;
	for( Row = 1; Row <= RowNumber; Row++ ) 
		{
		ULButtonY 		= (Row-1) * ButtonHeight + PanelYoffset;
		LRButtonY		= ULButtonY + ButtonHeight;
		Label 	= kStaticVarGetText("Label"+ColName+Row);
		TextColor 	= Nz(kStaticVarGet("TextColor"+ColName+Row));
		BackColor 	= Nz(kStaticVarGet("BackColor"+ColName+Row));
		GfxSelectSolidBrush( BackColor);
		GfxRectangle( ULButtonX, ULButtonY, LRButtonX, LRButtonY ); 
		GfxSetBkColor( BackColor);
		GfxSetTextColor( TextColor );
		GfxDrawText( Label, ULButtonX, ULButtonY, LRButtonX, LRButtonY, 32 | 1 | 4);
		}
	}
1 Star2 Stars3 Stars4 Stars5 Stars (4 votes, average: 5.00 out of 5)
Loading ... Loading ...

Button Header (Collapse/Expand)

Note: A number of variables and function names were changed to provide more consistent naming; please upgrade your code and Include file. I regret that such changes may happen rather often, however, the only alternative would be to complete all posts for this topic and publish them all at once. Since there is no guarantee that all code will ever be fully completed (most of my development work never stops), I think it is better to publish whatever is functional, as if this were a development blog.

The purpose of the Button Header is to name button columns (this is needed to key static variables) and provide a Collapse/Expand function for Button Columns. Clicking on a Button Header will alternatively Collapse and Expand button columns. This allows you to quickly expose chart sections that were hidden by the Control Panel. A collapsed Button Column will look like this:

clip_image002

Clicking on the Header Button will expand the column to look as show below:

clip_image002[5]

A few variables are displayed in the Title to facilitate debugging. The following listing shows the test code used to display the above Button Column. Note again that there are two ways to process button clicks: using the values returned by the button functions, or using the Switch() statement.

1
2
3
4
5
6
7
8
9
10
11
12
13
14
15
16
17
18
19
20
21
22
23
24
25
26
27
28
29
30
31
32
33
34
35
36
37
38
39
40
41
42
43
44
45
46
47
#include <ControlPanelInclude-003.afl>
 
global ColNumber;
RequestTimedRefresh(1);
ButtonHeight = Param("Button Height",20,5,200,1); 
ButtonWidth = Param("Button Width",120,5,200,1); 
PanelYoffset = Param("Button Row Offset (px)",10,0,Status("pxheight"),1); 
PanelXoffset = Param("Button Column Offset (px)",10,0,Status("pxwidth"),1); 
FontRatio = Param("Font: ButtonHeight ratio",2,1,20,0.1);
 
ButtonColumnBegin( "1" );
ButtonHeader( "COLUMN HEADER1", colorBlue, colorLightBlue,colorWhite);
ButtonText( "AUTO-TRADING ON", colorBlue, colorWhite);
Reset = ButtonTrigger( "START SESSION", colorBrightGreen, colorRed, colorBlack);
CancelAll = ButtonTrigger( "CANCEL ALL", colorBrightGreen, colorRed, colorBlack);
CloseAll = ButtonTrigger( "CLOSE ALL", colorBrightGreen, colorRed, colorBlack);
EndSession = ButtonTrigger( "END SESSION", colorBrightGreen, colorRed, colorBlack);
ButtonColumnEnd( );
 
ClickCoordinates = Nz(StaticVarGet("ClickCoordinates"));
switch( ClickCoordinates )
	{
	case 101:
	Say( "1 1");
	break;
	case 102:
	Say( "1 2");
	break;
	case 103:
	Say( "1 3");
	break;
	case 104:
	Say( "1 4");
	break;
	case 105:
	Say( "1 5");
	break;
	case 106:
	Say( "1 6");
	break;
	}
 
Plot(C,"",1,128);
 
Title = "\n"+
"  Click Coordinates: "+ClickCoordinates+"\n"+
"Column Expanded Var: "+Nz(kStaticVarGet(ColName+"ColExpanded"));

The ButtonHeader() is similar to the ButtonText() function but has a Collapse/Expand variable added. Here is the code for the new ButtonHeader() function:

1
2
3
4
5
6
7
8
9
10
11
12
13
14
15
16
17
18
19
function ButtonHeader( Label, backColor1, BackColor2, TextColor)
	{
	global ColNumber, RowNumber, ColExpanded, Colname;
	RowNumber = Nz(kStaticVarGet("RowNumber"+ColName))+1;
	kStaticVarSet("RowNumber"+ColName, RowNumber);
	Trigger = GetMouseClick( ColNumber, RowNumber );
	if( Trigger ) 
		{
		BackColor = backColor2; 
		ColExpanded = Nz(kStaticVarGet(ColName+"ColExpanded"));
		if( ColExpanded ) kStaticVarSet(ColName+"ColExpanded", False);
		else kStaticVarSet(ColName+"ColExpanded", True);
		}
	else BackColor = backColor1;
	ColExpanded = Nz(kStaticVarGet(ColName+"ColExpanded"));
	kStaticVarSetText("TextButton"+ColName+RowNumber, Label);
	kStaticVarSet("TextColor"+ColName+RowNumber, TextColor);
	kStaticVarSet("BackColor"+ColName+RowNumber, backColor);
	}

In the above code, when the left Mouse button is clicked, a static variable named ColExpanded is toggled between True and False. All earlier button functions have been modified to only execute their internal code only if this variable is True. This way Buttons will only display if the variable ColExpanded it True. The listing below shows how the TriggerButton() was modified. This and the HeaderButton functions are located in the Include file at the end of this post; there is no need to copy them separately.

1
2
3
4
5
6
7
8
9
10
11
12
13
14
15
16
17
18
function ButtonTrigger( Label, backColor1, BackColor2, TextColor)
	{
	global ColNumber, RowNumber, ColName;
	ColExpanded = Nz(kStaticVarGet(ColName+"ColExpanded"));
	if( ColExpanded )
		{
		ColName = VarGetText("ColName");
		RowNumber = Nz(kStaticVarGet("RowNumber"+ColName))+1;
		kStaticVarSet("RowNumber"+ColName, RowNumber);
		Trigger = GetMouseClick( ColNumber, RowNumber );
		if( Trigger ) BackColor = backColor2; else BackColor = backColor1;
		kStaticVarSetText("TextButton"+ColName+RowNumber, Label);
		kStaticVarSet("TextColor"+ColName+RowNumber, TextColor);
		kStaticVarSet("BackColor"+ColName+RowNumber, backColor);
		}
	else Trigger = 0;
	return Trigger;
	}

The new ControlPanelInclude-003.afl Include file is listed below, it must be copied to your default Include folder for the above code to work.

1
2
3
4
5
6
7
8
9
10
11
12
13
14
15
16
17
18
19
20
21
22
23
24
25
26
27
28
29
30
31
32
33
34
35
36
37
38
39
40
41
42
43
44
45
46
47
48
49
50
51
52
53
54
55
56
57
58
59
60
61
62
63
64
65
66
67
68
69
70
71
72
73
74
75
76
77
78
79
80
81
82
83
84
85
86
87
88
89
90
91
92
93
94
95
96
97
98
99
100
101
102
103
104
105
106
107
108
109
110
111
112
113
114
115
116
117
118
119
120
121
122
123
124
125
126
127
128
129
130
131
132
133
134
135
136
137
138
139
140
141
142
143
144
145
146
147
148
149
150
151
152
// ControlPanelInclude-003.afl
procedure kStaticVarSet( SName, SValue ) 		
	{
	ChartID = GetChartID();
	InIndicator = Status("Action") == 1;
	if( InIndicator ) StaticVarSet(Sname+ChartID, Svalue); 
	}
 
function kStaticVarGet( SName ) 					
	{ 
	ChartID 	= GetChartID();
	Var = StaticVarGet(Sname+ChartID);
	return Var;
	}
 
procedure kStaticVarSetText( SName, SValue ) 	
	{ 
	ChartID 	= GetChartID();
	InIndicator = Status("Action") == 1;
	if( InIndicator ) StaticVarSetText(Sname+ChartID, Svalue); 
	}
 
function kStaticVarGetText( SName ) 				
	{ 
	ChartID = GetChartID();
	return StaticVarGetText(Sname+ChartID); 
	}
 
function NewColumn()
	{
	VarSet("ColNumber", 0);
	}
 
function GetMouseClick( ColNumber, RowNumber )
	{
	global PanelYoffset, PanelXoffset, ButtonHeight, ButtonWidth;
	LButtonDown = GetCursorMouseButtons() == 9;
	Click = 0;
	if( LButtonDown )
		{
		ULButtonX 		= PanelXoffset + (ColNumber-1) * ButtonWidth;
		LRButtonX		= ULButtonX + ButtonWidth;
		ULButtonY 		= (RowNumber -1) * ButtonHeight + PanelYoffset;
		LRButtonY		= ULButtonY + ButtonHeight;
		MouseCoord = Nz(StaticVarGet("ClickCoordinates"));
		if( MouseCoord == 0 AND LButtonDown )
			{
			MousePx = GetCursorXPosition( 1 );
			MousePy = GetCursorYPosition( 1 );
			if( MousePx > ULButtonX AND MousePx < LRButtonX AND MousePy > ULButtonY AND MousePy < LRButtonY )
				{
				StaticVarSet("ClickCoordinates",ColNumber*100+RowNumber);
				Click = 1;
				}
			}
		}
	return Click;
	}
 
function ButtonColumnBegin( ColName ) 
	{
	global FontRatio, ColName, ColNumber, ButtonHeight, ButtonWidth, PanelXoffset, PanelYoffset, Colname;
	ColNumber = VarGet("ColNumber");
	if( IsEmpty( ColNumber ) ) 
		{
		VarSet("ColNumber",1);
		StaticVarSet("ClickCoordinates",0);
		}
	else VarSet("ColNumber", ++ColNumber);
	ColName = ColName+GetChartID();
	kStaticVarSet("RowNumber"+ColName, 0);
	VarSetText("ColName",ColName);
	GfxSetOverlayMode( 0 );
	GfxSelectFont( "Tahoma", ButtonHeight/FontRatio, 800 ); 
	GfxSelectPen( colorBlack ); 
	GfxSetBkMode( 1 );
	}
 
function ButtonText( TextButton, backColor, TextColor)
	{
	global ColNumber, RowNumber, Colname;
	ColExpanded = Nz(kStaticVarGet(ColName+"ColExpanded"));
	if( ColExpanded )
		{
		ColName = VarGetText("ColName");
		RowNumber = Nz(kStaticVarGet("RowNumber"+ColName))+1;
		kStaticVarSet("RowNumber"+ColName, RowNumber);
		kStaticVarSetText("TextButton"+ColName+RowNumber, TextButton);
		kStaticVarSet("TextColor"+ColName+RowNumber, TextColor);
		kStaticVarSet("BackColor"+ColName+RowNumber, backColor);
		}
	}
 
function ButtonTrigger( Label, backColor1, BackColor2, TextColor)
	{
	global ColNumber, RowNumber, ColName;
	ColExpanded = Nz(kStaticVarGet(ColName+"ColExpanded"));
	if( ColExpanded )
		{
		ColName = VarGetText("ColName");
		RowNumber = Nz(kStaticVarGet("RowNumber"+ColName))+1;
		kStaticVarSet("RowNumber"+ColName, RowNumber);
		Trigger = GetMouseClick( ColNumber, RowNumber );
		if( Trigger ) BackColor = backColor2; else BackColor = backColor1;
		kStaticVarSetText("TextButton"+ColName+RowNumber, Label);
		kStaticVarSet("TextColor"+ColName+RowNumber, TextColor);
		kStaticVarSet("BackColor"+ColName+RowNumber, backColor);
		}
	else Trigger = 0;
	return Trigger;
	}
 
function ButtonHeader( Label, backColor1, BackColor2, TextColor)
	{
	global ColNumber, RowNumber, ColExpanded, Colname;
	RowNumber = Nz(kStaticVarGet("RowNumber"+ColName))+1;
	kStaticVarSet("RowNumber"+ColName, RowNumber);
	Trigger = GetMouseClick( ColNumber, RowNumber );
	if( Trigger ) 
		{
		BackColor = backColor2; 
		ColExpanded = Nz(kStaticVarGet(ColName+"ColExpanded"));
		if( ColExpanded ) kStaticVarSet(ColName+"ColExpanded", False);
		else kStaticVarSet(ColName+"ColExpanded", True);
		}
	else BackColor = backColor1;
	ColExpanded = Nz(kStaticVarGet(ColName+"ColExpanded"));
	kStaticVarSetText("TextButton"+ColName+RowNumber, Label);
	kStaticVarSet("TextColor"+ColName+RowNumber, TextColor);
	kStaticVarSet("BackColor"+ColName+RowNumber, backColor);
	}
 
function ButtonColumnEnd()
	{
	global ButtonHeight, ButtonWidth, PanelYoffset, PanelXoffset, ColNumber, RowNumber, ColName;
	ChartIDStr 	= NumToStr(GetChartID(),1.0,False);
	ULButtonX 		= PanelXoffset + (ColNumber-1) * ButtonWidth;
	LRButtonX		= ULButtonX + ButtonWidth;
	for( Row = 1; Row <= RowNumber; Row++ ) 
		{
		ULButtonY 		= (Row-1) * ButtonHeight + PanelYoffset;
		LRButtonY		= ULButtonY + ButtonHeight;
		Label 	= kStaticVarGetText("TextButton"+ColName+Row);
		TextColor 	= Nz(kStaticVarGet("TextColor"+ColName+Row));
		BackColor 	= Nz(kStaticVarGet("BackColor"+ColName+Row));
		GfxSelectSolidBrush( BackColor);
		GfxRectangle( ULButtonX, ULButtonY, LRButtonX, LRButtonY ); 
		GfxSetBkColor( BackColor);
		GfxSetTextColor( TextColor );
		GfxDrawText( Label, ULButtonX, ULButtonY, LRButtonX, LRButtonY, 32 | 1 | 4);
		}
	}
1 Star2 Stars3 Stars4 Stars5 Stars (3 votes, average: 5.00 out of 5)
Loading ... Loading ...

Command Buttons (Trigger type)

This series of posts is actually written while the functions are being developed. It is for this reason that the functions and Include file may change with each next post. Hopefully they will be better with each revision. Please always use the latest versions.

There have been many requests for on-chart custom Command Buttons. Command Buttons are mouse-click sensitive buttons or menu-items that, when clicked on, will execute a specific section of AFL code. This post introduces Command Buttons of the Trigger-type that respond to Left-Button clicks. This Trigger Button can be used in the same way you would use the ParamTrigger() function. Note that the first button does not respond to mouse-clicks; it is not a trigger button. The TextCell was designed to display text only, for example to display status information for your trading system. Here is an example of a simple horizontal layout:

triggerbuttons.png

To display the buttons horizontally lengthens the code a little because the code is optimized for vertical button columns. Here is the code that places the above button array on your chart:

1
2
3
4
5
6
7
8
9
10
11
12
13
14
15
16
17
18
19
20
21
22
23
24
25
26
27
28
29
30
31
32
33
34
35
36
37
38
39
40
41
42
43
44
45
46
47
48
49
50
#include <ControlPanelInclude-001.afl>
 
global ColNumber;
RequestTimedRefresh(1);
CellHeight = Param("Cell Height",20,5,200,1); 
CellWidth = Param("Cell Width",120,5,200,1); 
PanelYoffset = Param("Cell Row Offset (px)",10,0,Status("pxheight"),1); 
PanelXoffset = Param("Cell Column Offset (px)",10,0,Status("pxwidth"),1); 
FontRatio = Param("Font: CellHeight ratio",2,1,20,0.1);
 
Column_Begin( "1" );
TextCell( "AUTO-TRADING", colorRed, colorBlack);
Column_End( );
 
Column_Begin( "2" );
Reset = TriggerCell( "START SESSION", colorBrightGreen, colorRed, colorBlack);
Column_End( );
 
Column_Begin( "3" );
CancelAll = TriggerCell( "CANCEL ALL", colorBrightGreen, colorRed, colorBlack);
Column_End( );
 
Column_Begin( "4" );
CloseAll = TriggerCell( "CLOSE ALL", colorBrightGreen, colorRed, colorBlack);
Column_End( );
 
Column_Begin( "5");
EndSession = TriggerCell( "END SESSION", colorBrightGreen, colorRed, colorBlack);
Column_End( );
 
ClickCoordinates = Nz(StaticVarGet("ClickCoordinates"));
switch( ClickCoordinates )
	{
	case 201:
	Say( "201");
	break;
	case 301:
	Say( "301");
	break;
	case 401:
	Say( "401");
	break;
	case 501:
	Say( "501");
	break;
	}
 
Plot(C,"",1,128);
 
Title = "CLICK COORDINATES: "+ClickCoordinates;

The Trigger function returns a trigger, i.e., a True state that lasts only for the current refresh and that returns False at the next pass through the code. A Triggername is assigned to each button and is used to key the static variables. Backcolor1 is the normal color of the button. Backcolor2 is the color the button takes on when it is clicked on; this gives a visual confirmation that the click was registered. If a button is clicked on, the button coordinates (vertical position, horizontal position) are returned in compressed for as ColNumber*100+RowNumber.

Trigger action can be invoked in two ways: by checking the value returned by the trigger functions, and by processing the click-coordinates in a Switch() statement. Each method may have advantages depending on the application.

Below a listing of the revised Include file, please copy to your default include folder.

1
2
3
4
5
6
7
8
9
10
11
12
13
14
15
16
17
18
19
20
21
22
23
24
25
26
27
28
29
30
31
32
33
34
35
36
37
38
39
40
41
42
43
44
45
46
47
48
49
50
51
52
53
54
55
56
57
58
59
60
61
62
63
64
65
66
67
68
69
70
71
72
73
74
75
76
77
78
79
80
81
82
83
84
85
86
87
88
89
90
91
92
93
94
95
96
97
98
99
100
101
102
103
104
105
106
107
108
109
110
111
112
113
114
115
116
117
118
119
120
121
122
123
124
125
// ControlPanelInclude-001.afl
procedure kStaticVarSet( SName, SValue ) 		
	{
	ChartID = GetChartID();
	InIndicator = Status("Action") == 1;
	if( InIndicator ) StaticVarSet(Sname+ChartID, Svalue); 
	}
 
function kStaticVarGet( SName ) 					
	{ 
	ChartID 	= GetChartID();
	Var = StaticVarGet(Sname+ChartID);
	return Var;
	}
 
procedure kStaticVarSetText( SName, SValue ) 	
	{ 
	ChartID 	= GetChartID();
	InIndicator = Status("Action") == 1;
	if( InIndicator ) StaticVarSetText(Sname+ChartID, Svalue); 
	}
 
function kStaticVarGetText( SName ) 				
	{ 
	ChartID = GetChartID();
	return StaticVarGetText(Sname+ChartID); 
	}
 
function Column_Begin( ColName ) 
	{
	global FontRatio, ColName, ColNumber, CellHeight, CellWidth, PanelXoffset, PanelYoffset;
	ColNumber = VarGet("ColNumber");
	if( IsEmpty( ColNumber ) ) 
		{
		VarSet("ColNumber",1);
		StaticVarSet("ClickCoordinates",0);
		}
	else VarSet("ColNumber", ++ColNumber);
	ColName = ColName+GetChartID();
	GfxSetOverlayMode( 0 );
	GfxSelectFont( "Tahoma", CellHeight/FontRatio, 800 ); 
	GfxSelectPen( colorBlack ); 
	GfxSetBkMode( 1 );
	kStaticVarSet("RowNumber"+ColName, 0);
	VarSetText("ColName",ColName);
	return ColNumber;
	}
 
function Column_End( )
	{
	global CellHeight, CellWidth, PanelYoffset, PanelXoffset, ColNumber, RowNumber;
	ChartIDStr 	= NumToStr(GetChartID(),1.0,False);
	ColName 		= VarGetText("ColName");
	ULCellX 		= PanelXoffset + (ColNumber-1) * CellWidth;
	LRCellX		= ULCellX + CellWidth;
	for( Row = 1; Row <= RowNumber; Row++ ) 
		{
		ULCellY 		= (Row-1) * CellHeight + PanelYoffset;
		LRCellY		= ULCellY + CellHeight;
		TextCell 	= kStaticVarGetText("TextCell"+ColName+Row);
		TextColor 	= Nz(kStaticVarGet("TextColor"+ColName+Row));
		BackColor 	= Nz(kStaticVarGet("BackColor"+ColName+Row));
		GfxSelectSolidBrush( BackColor);
		GfxRectangle( ULCellX, ULCellY, LRCellX, LRCellY ); 
		GfxSetBkColor( BackColor);
		GfxSetTextColor( TextColor );
		GfxDrawText( TextCell, ULCellX, ULCellY, LRCellX, LRCellY, 32 | 1 | 4);
		}
	}
 
function TextCell( TextCell, backColor, TextColor)
	{
	global ColNumber, RowNumber;;
	ColName = VarGetText("ColName");
	RowNumber = Nz(kStaticVarGet("RowNumber"+ColName))+1;
	kStaticVarSet("RowNumber"+ColName, RowNumber);
	kStaticVarSetText("TextCell"+ColName+RowNumber, TextCell);
	kStaticVarSet("TextColor"+ColName+RowNumber, TextColor);
	kStaticVarSet("BackColor"+ColName+RowNumber, backColor);
	}
 
function NewColumn()
	{
	VarSet("ColNumber", 0);
	}
 
function CheckMouseClick( ColNumber, RowNumber )
	{
	global PanelYoffset, PanelXoffset, CellHeight, CellWidth;
	LButtonDown = GetCursorMouseButtons() == 9;
	Click = 0;
	if( LButtonDown )
		{
		ULCellX 		= PanelXoffset + (ColNumber-1) * CellWidth;
		LRCellX		= ULCellX + CellWidth;
		ULCellY 		= (RowNumber -1) * CellHeight + PanelYoffset;
		LRCellY		= ULCellY + CellHeight;
		MouseCoord = Nz(StaticVarGet("ClickCoordinates"));
		if( MouseCoord == 0 AND LButtonDown )
			{
			MousePx = GetCursorXPosition( 1 );
			MousePy = GetCursorYPosition( 1 );
			if( MousePx > ULCellX AND MousePx < LRCellX AND MousePy > ULCellY AND MousePy < LRCellY )
				{
				StaticVarSet("ClickCoordinates",ColNumber*100+RowNumber);
				Click = 1;
				}
			}
		}
	return Click;
	}
 
function TriggerCell( Label, backColor1, BackColor2, TextColor)
	{
	global ColNumber, RowNumber;;
	ColName = VarGetText("ColName");
	RowNumber = Nz(kStaticVarGet("RowNumber"+ColName))+1;
	kStaticVarSet("RowNumber"+ColName, RowNumber);
	Trigger = CheckMouseClick( ColNumber, RowNumber );
	if( Trigger ) BackColor = backColor2; else BackColor = backColor1;
	kStaticVarSetText("TextCell"+ColName+RowNumber, Label);
	kStaticVarSet("TextColor"+ColName+RowNumber, TextColor);
	kStaticVarSet("BackColor"+ColName+RowNumber, backColor);
	return Trigger;
	}
1 Star2 Stars3 Stars4 Stars5 Stars (4 votes, average: 5.00 out of 5)
Loading ... Loading ...

A Basic Messaging Panel

Also see Moving Low Level Graphics (GFX) Objects on your Charts

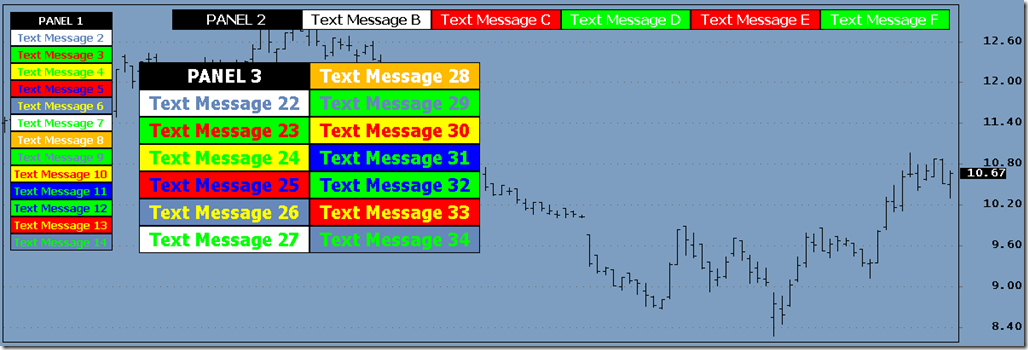
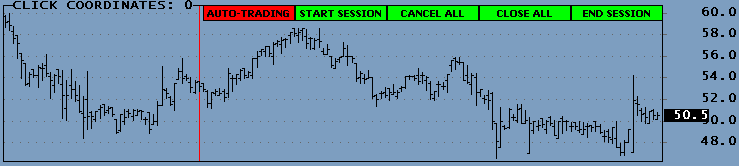
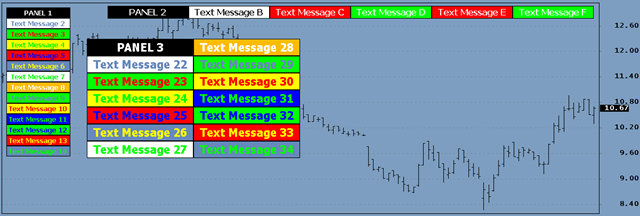
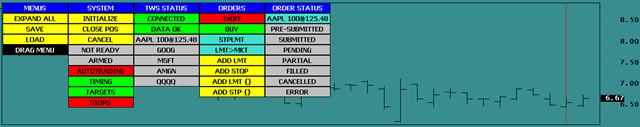
This first post introduces you to the basic techniques on how to create a matrix of text cells to display messages and system status on your chart. At this stage the cells are not mouse-click sensitive; this and other features will be added later. In this example the number of columns, rows, the font size, and the location of the message panel, can be set from the Param window. In your final application you might want to make these parameters constant and remove the corresponding Param statements. You can combine any number of Panels, here is an example for multiple panels layouts:

image

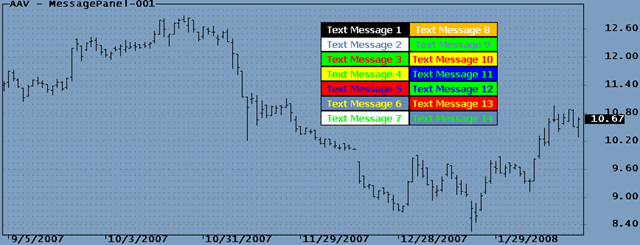
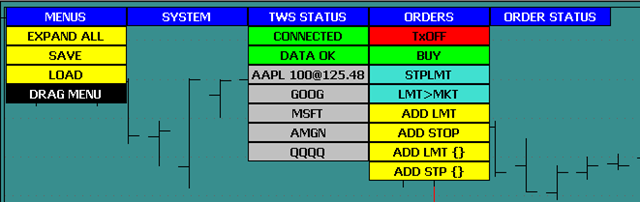
The following simple panel is produced by the code in this post.

image

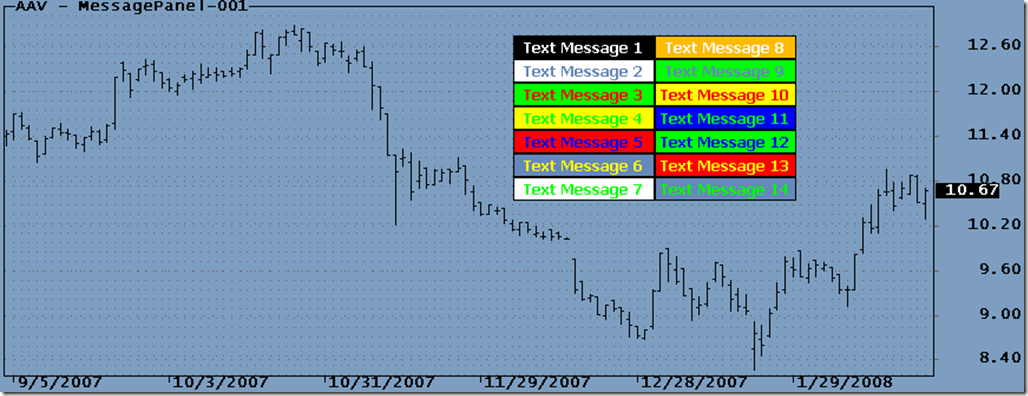
The code below will place the above Message panel on your chart. A code description follows below listing.

1
2
3
4
5
6
7
8
9
10
11
12
13
14
15
16
17
18
19
20
21
22
23
24
25
26
27
28
29
30
31
32
33
34
35
36
37
38
39
40
41
42
43
44
45
46
47
48
49
50
 
#include <MessagePanelInclude.afl>
 
global ColNumber;
 
CellHeight = Param("Cell Height",20,5,200,5);
 
CellWidth = Param("Cell Width",120,5,200,5);
 
PanelYoffset = Param("Cell Row Offset (px)",10,0,Status("pxheight"),5);
 
PanelXoffset = Param("Cell Column Offset (px)",10,0,Status("pxwidth"),5);
 
FontRatio = Param("Font:CellHeight ratio",2,1,20,0.1);
 
MsgCol_Begin( "COLUMNNAME 1", CellHeight, CellWidth, PanelXoffset, PanelYoffset );
 
TextCell( "Text Message 1", BackgroundColor=1, TextColor=2);
 
TextCell( "Text Message 2", 2, 3);
 
TextCell( "Text Message 3", 8, 4);
 
TextCell( "Text Message 4", 7, 5);
 
TextCell( "Text Message 5", 4, 6);
 
TextCell( "Text Message 6", 3, 7);
 
TextCell( "Text Message 7", 2, 8);
 
MsgCol_End();
 
MsgCol_Begin( " COLUMNNAME 2", CellHeight, CellWidth, PanelXoffset, PanelYoffset );
 
TextCell( "Text Message 1", 9, 2);
 
TextCell( "Text Message 2", 8, 3);
 
TextCell( "Text Message 3", 7, 4);
 
TextCell( "Text Message 4", 6, 5);
 
TextCell( "Text Message 5", 5, 6);
 
TextCell( "Text Message 6", 4, 7);
 
TextCell( "Text Message 7", 3, 8);
 
MsgCol_End();

Message Panel code above calls the Include file listed at the end of this post. The The MsgCol_Begin() function defines the name and dimensions for the current column:

1
MsgCol_Begin( "COLUMNNAME 1", CellHeight, CellWidth, PanelXoffset, PanelYoffset );

You can create many columns. The ColName is used in Static variables to allow the code to know to which Column the TextCells belong. The last four arguments are self-explanatory. The Overlay and background modes can be changed inside this function, or you can extract these GFX statements and execute them separately.

The TextCell() function adds one TextCell to the column. It defines the Message, Background color, and TextColor to be used:

1
2
 
TextCell( "Text Message 1", colorBlack, colorWhite);

The MsgCol_End() terminates the current column and draws the GFX pgraphics to the chart.

The Include file makes extensive use of static variables that are wrapped in kStaticVar…() to make the static variables unique to the current ChartID. This is needed to call the functions from different panes and windows without interfering with one another. For more on this see Keying Static Variables.

1
2
3
4
5
6
7
8
9
10
11
12
13
14
15
16
17
18
19
20
21
22
23
24
25
26
27
28
29
30
31
32
33
34
35
36
37
38
39
40
41
42
43
44
45
46
47
48
49
50
51
52
53
54
55
56
57
58
59
60
61
62
63
64
65
66
67
68
69
70
71
72
73
74
75
76
77
78
79
80
81
82
83
84
85
86
87
88
89
90
91
92
93
94
95
96
97
98
99
100
101
102
103
104
105
106
107
108
109
110
111
112
113
114
115
116
117
118
119
120
121
122
123
124
125
126
127
128
129
130
131
132
133
134
135
136
137
138
139
140
141
142
143
144
145
146
147
148
149
150
151
152
153
154
 
// This is the Include file MessagePanelInclude.afl, copy to your default Include folder
 
procedure kStaticVarSet( SName, SValue )
 
{
 
ChartID = GetChartID();
 
InIndicator = Status("Action") == 1;
 
if( InIndicator ) StaticVarSet(Sname+ChartID, Svalue);
 
}
 
function kStaticVarGet( SName )
 
{
 
ChartID = GetChartID();
 
Var = StaticVarGet(Sname+ChartID);
 
return Var;
 
}
 
procedure kStaticVarSetText( SName, SValue )
 
{
 
ChartID = GetChartID();
 
InIndicator = Status("Action") == 1;
 
if( InIndicator ) StaticVarSetText(Sname+ChartID, Svalue);
 
}
 
function kStaticVarGetText( SName )
 
{
 
ChartID = GetChartID();
 
return StaticVarGetText(Sname+ChartID);
 
}
 
function MsgCol_Begin( ColName, CellHeight, CellWidth, PanelXoffset, PanelYoffset )
 
{
 
global FontRatio, ColName, ColNumber;
 
ColNumber = VarGet("ColNumber");
 
if( IsEmpty( ColNumber ) ) VarSet("ColNumber",1);
 
else VarSet("ColNumber", ++ColNumber);
 
ColName = ColName+GetChartID();
 
GfxSetOverlayMode( 0 );
 
GfxSelectFont( "Tahoma", CellHeight/FontRatio, 800 );
 
GfxSelectPen( colorBlack );
 
GfxSetBkMode( 1 );
 
kStaticVarSet("PanelItemNum"+ColName, 0);
 
VarSetText("ColName",ColName);
 
return ColNumber;
 
}
 
function MsgCol_End( )
 
{
 
global CellHeight, CellWidth, PanelYoffset, PanelXoffset, ColNumber, PanelItemNum;
 
ChartIDStr = NumToStr(GetChartID(),1.0,False);
 
ColName = VarGetText("ColName");
 
ULCellX = PanelXoffset + (ColNumber-1) * CellWidth;
 
LRCellX = ULCellX + CellWidth;
 
for( Row = 1; Row <= PanelItemNum; Row++ )
 
{
 
ULCellY = (Row-1) * CellHeight + PanelYoffset;
 
LRCellY = ULCellY + CellHeight;
 
TextCell = kStaticVarGetText("TextCell"+ColName+Row);
 
TextColor = Nz(kStaticVarGet("TextColor"+ColName+Row));
 
BackColor = Nz(kStaticVarGet("BackColor"+ColName+Row));
 
if( Row==1) TextCell = StrReplace( TextCell, ChartIDStr, "");
 
GfxSelectSolidBrush( BackColor);
 
GfxRectangle( ULCellX, ULCellY, LRCellX, LRCellY );
 
GfxSetBkColor( BackColor);
 
GfxSetTextColor( TextColor );
 
GfxDrawText( TextCell, ULCellX, ULCellY, LRCellX, LRCellY, 32 | 1 | 4);
 
}
 
}
 
function TextCell( TextCell, backColor, TextColor)
 
{
 
global InitializePanels, PanelVisible;
 
ColName = VarGetText("ColName");
 
PanelItemNum = Nz(kStaticVarGet("PanelItemNum"+ColName))+1;
 
kStaticVarSet("PanelItemNum"+ColName, PanelItemNum);
 
kStaticVarSet("CellState"+ColName+PanelItemNum, False);
 
Label = StrExtract(TextCell,0);
 
kStaticVarSetText("TextCell"+ColName+PanelItemNum, Label);
 
kStaticVarSet("TextColor"+ColName+PanelItemNum, TextColor);
 
kStaticVarSet("BackColor"+ColName+PanelItemNum, backColor);
 
}
 
function Newpanel()
 
{
 
VarSet("ColNumber", 0);
 
}

For those who want to experiment with multi-panel layouts here is the code used to produce the xample shown earlier:

1
2
3
4
5
6
7
8
9
10
11
12
13
14
15
16
17
18
19
20
21
22
23
24
25
26
27
28
29
30
31
32
33
34
35
36
37
38
39
40
41
42
43
44
45
46
47
48
49
50
51
52
53
54
55
56
57
58
59
60
61
62
63
64
65
66
67
68
69
70
71
72
73
74
75
76
77
78
79
80
81
82
83
84
#include
 
global ColNumber;
_SECTION_BEGIN("MESSAGE PANEL 1");
CellHeight				= Param("Cell Height",20,5,200,1);
CellWidth 				= Param("Cell Width",120,5,200,1);
PanelYoffset 			= Param("Cell Row Offset (px)",10,0,Status("pxheight"),1);
PanelXoffset			= Param("Cell Column Offset (px)",10,0,Status("pxwidth"),1);
FontRatio   			= Param("Font:CellHeight ratio",2,1,20,0.1);
 
MsgCol_Begin( "COLUMNNAME  1", CellHeight, CellWidth, PanelXoffset, PanelYoffset );
TextCell( "PANEL 1", colorBlack, colorWhite);
TextCell( "Text Message 2", 2, 3);
TextCell( "Text Message 3", 8, 4);
TextCell( "Text Message 4", 7, 5);
TextCell( "Text Message 5", 4, 6);
TextCell( "Text Message 6", 3, 7);
TextCell( "Text Message 7", 2, 8);
TextCell( "Text Message 8", 9, 2);
TextCell( "Text Message 9", 8, 3);
TextCell( "Text Message 10", 7, 4);
TextCell( "Text Message 11", 6, 5);
TextCell( "Text Message 12", 5, 6);
TextCell( "Text Message 13", 4, 7);
TextCell( "Text Message 14", 3, 8);
MsgCol_End();
_SECTION_END();
 
_SECTION_BEGIN("MESSAGE PANEL 2");
CellHeight				= Param("2Cell Height",20,5,200,1);
CellWidth 				= Param("2Cell Width",120,5,200,1);
PanelYoffset 			= Param("2Cell Row Offset (px)",10,0,Status("pxheight"),1);
PanelXoffset			= Param("2Cell Column Offset (px)",10,0,Status("pxwidth"),1);
FontRatio   			= Param("2Font:CellHeight ratio",2,1,20,0.1);
 
Newpanel();
MsgCol_Begin( "COLUMNNAME  1", CellHeight, CellWidth, PanelXoffset, PanelYoffset );
TextCell( "PANEL 2", 1, colorWhite);
MsgCol_End();
MsgCol_Begin( "COLUMNNAME  1", CellHeight, CellWidth, PanelXoffset, PanelYoffset );
TextCell( "Text Message B", 2, 1);
MsgCol_End();
MsgCol_Begin( "COLUMNNAME  1", CellHeight, CellWidth, PanelXoffset, PanelYoffset );
TextCell( "Text Message C", 4, colorWhite);
MsgCol_End();
MsgCol_Begin( "COLUMNNAME  1", CellHeight, CellWidth, PanelXoffset, PanelYoffset );
TextCell( "Text Message D", 5, colorWhite);
MsgCol_End();
MsgCol_Begin( "COLUMNNAME  1", CellHeight, CellWidth, PanelXoffset, PanelYoffset );
TextCell( "Text Message E", 4, colorWhite);
MsgCol_End();
MsgCol_Begin( "COLUMNNAME  1", CellHeight, CellWidth, PanelXoffset, PanelYoffset );
TextCell( "Text Message F", 5, colorWhite);
MsgCol_End();
_SECTION_END();
 
_SECTION_BEGIN("MESSAGE PANEL 3");
Newpanel();
CellHeight				= Param("1Cell Height",20,5,200,1);
CellWidth 				= Param("1Cell Width",120,5,200,1);
PanelYoffset 			= Param("1Cell Row Offset (px)",10,0,Status("pxheight"),1);
PanelXoffset			= Param("1Cell Column Offset (px)",10,0,Status("pxwidth"),1);
FontRatio   			= Param("1Font:CellHeight ratio",2,1,20,0.1);
 
MsgCol_Begin( "COLUMNNAME  1", CellHeight, CellWidth, PanelXoffset, PanelYoffset );
TextCell( "PANEL 3", colorBlack, colorWhite);
TextCell( "Text Message 22", 2, 3);
TextCell( "Text Message 23", 8, 4);
TextCell( "Text Message 24", 7, 5);
TextCell( "Text Message 25", 4, 6);
TextCell( "Text Message 26", 3, 7);
TextCell( "Text Message 27", 2, 8);
MsgCol_End();
 
MsgCol_Begin( "COLUMNNAME  2", CellHeight, CellWidth, PanelXoffset, PanelYoffset );
TextCell( "Text Message 28", 9, 2);
TextCell( "Text Message 29", 8, 3);
TextCell( "Text Message 30", 7, 4);
TextCell( "Text Message 31", 6, 5);
TextCell( "Text Message 32", 5, 6);
TextCell( "Text Message 33", 4, 7);
TextCell( "Text Message 34", 3, 8);
MsgCol_End();
_SECTION_END();
1 Star2 Stars3 Stars4 Stars5 Stars (4 votes, average: 4.75 out of 5)
Loading ... Loading ...

Introduction to Real-Time Control-Panels

IMPORTANT NOTES:

1) Posts in this category are published as code is developed and you should use the most recent version posted. This code is shared without extensive field testing and may contain errors or function different than you expect. Always verify that the code does what you want it to do before using it in a real application. This publishing method is used to give you a chance to use it at the current stage of development, else you would have to wait until all functions are completed – and that time might never come :-)

2) All code on the UKB takes advantage of the latest AFL functions. If you encounter problems, and before posting questions, please verify that you are running the latest AmiBroker beta software. New releases are usually announced in the AmiBroker Development Log. The code you find here is modified too frequently to add/maintain version() statements to/in all programs published.

3) The code covered in this series of posts make extensive use of GFX functions please read the posts in the GFX Programming category.

==========

In Real-Time trading it is handy to use "Control Panels". Control Panels are custom button layouts that can be used to change system settings, and give Real-Time visual feedback on the state of the system. Clicking any of the buttons lets you execute specific code with a single mouse click. While the AmiBroker Parameter window is very useful for use with Indicators it lacks important features needed in Real-Time. Posts in this category will cover the development of a custom menu system for use in Real-Time applications. It will offer: relocatable and collapsible menus, dynamic coloring, multi-state toggles, dynamic labels, sizable buttons and fonts, status indicators, unlimited menu columns, etc. Of course you can conceive and add your own special functions. The main code can be placed in an Include file and menus and buttons can be added to your code with statements somewhat similar to the AmiBroker Param(). The code below generates the first column for the test menu shown in the image below the code.

1
2
3
4
5
6
7
Menu_Begin( "MENUS", ButtonHeight, ButtonWidth, MenuXoffset, MenuYoffset );       
MenuMinimized = MenuHeader( BLU, WHT);        
ExpandAll = MenuTrigger( "EXPAND ALL", ColorTrigger, ColorTriggerOn, BLK );        
SaveMenus = MenuTrigger( "SAVE", ColorTrigger, ColorTriggerOn, BLK );        
LoadMenus = MenuTrigger( "LOAD", ColorTrigger, ColorTriggerOn, BLK );        
MovingMenu = ButtonRotate( "MOVING,DRAG MENU", "4,1", "7,2");       
Menu_End();

A Rotate button changes state with each click. It can function as a ParamToggle() but can also be used to rotate through multiple states like Buy, Sell, Short, and Cover just by clicking the button multiple times. Each click can change the Button label and color. Here is a typical menu layout:

image

Menus can be collapsed by Double-Clicking on any of the Blue headers. This means you can uncover hidden chart sections instantly, without having to move the menu block. In its collapsed state the menu looks like this:

image

You can also collapse individual menus with a single click on the blue header, as shown below.

image

Posts in this series will progress through various prerequisites and building blocks to help you design your own menu layout.

1 Star2 Stars3 Stars4 Stars5 Stars (6 votes, average: 5.00 out of 5)
Loading ... Loading ...

Reading/Backing-up the TWS Exported Execution Report

Please be sure you set up the TWS according to the instructions provided in Setting Up your TWS before you test this code. The code presented here reads the execution report, converts it to a .csv format, date-stamps it, backs it up for later use, and optionally displays it in the chart Title. The code doesn’t do anything important besides displaying the information in the Title. The idea is to show you how to read the file so that you can extract real execution prices, use them in your calculations, and plot them on your chart. The Param options are self-explanatory:

clip_image002

The name used for the execution report generated by the TWS is not date-stamped. For example, if you set up the TWS to export executions under the name Simulated.Trades, this same name will be used on successive days. If the TWS finds a tradelist from the previous day, it will simply overwrite it. To prevent losing this AFL readable file it is important to back up the tradelist at the end of the day. The format of the execution report exported by the TWS looks like this:

ATVI;SLD;75;26.19;21:29:33;20080125;ARCA;DU1195;;;DEMO;
ALTR;BOT;100;18.54;21:53:12;20080125;ARCA;DU1195;;;DEMO;
ALTR;BOT;100;18.58;21:55:59;20080125;ISLAND;DU1195;;;DEMO;
ALTR;BOT;100;18.55;21:56:00;20080125;ARCA;DU1195;;;DEMO;
ALTR;BOT;100;18.58;21:58:47;20080125;ISLAND;DU1195;;;DEMO;

The .csv format of the backup file produced by the code below can be directly imported into Excel and looks like this (note the semicolons have been replaced by commas):

ATVI,SLD,75,26.19,21:29:33,20080125,ARCA,DU1195,,,DEMO,
ALTR,BOT,100,18.54,21:53:12,20080125,ARCA,DU1195,,,DEMO,
ALTR,BOT,100,18.58,21:55:59,20080125,ISLAND,DU1195,,,DEMO,
ALTR,BOT,100,18.55,21:56:00,20080125,ARCA,DU1195,,,DEMO,
ALTR,BOT,100,18.58,21:58:47,20080125,ISLAND,DU1195,,,DEMO,

In Excel, the file will look like this after activating Text to columns:

clip_image004

Please be aware that the minimum update interval that the TWS exports the execution report is approximately one-minute. This means it will take some time for your trades to show up in the list.

Before tackling the main backup function, there are a few helper functions you will need. While these are available elsewhere on this site, they are repeated below for your convenience. To prevent conflicts between static variables used in different programs, you should key their names with those charted; see Keying Static Variables for more information on this. The DateNumToStr() converts DateNumbers to a standard date string.

The TWSBackupTradeList( TWSInputPath ) listed below reads the TWS tradelist, extracts the date, converts it to the .csv format, saves it in a different location, and optionally displays both tradelists in the chart Title. To test this function, Apply it to a new Indicator, open the Param window, set up the parameters, and click BACKUP. The backup file is saved in the path defined by the TradebackupFolder variable. If the function finds the execution report and its display is turned on in the Param window, this should look like this in the Title (only a few lines shown):

clip_image006

And, when displayed, the backup file should look like that below:

clip_image008

1
2
3
4
5
6
7
8
9
10
11
12
13
14
15
16
17
18
19
20
21
22
23
24
25
26
27
28
29
30
31
32
33
34
35
36
37
38
39
40
41
42
43
44
45
46
47
48
49
50
51
52
53
54
55
56
57
58
59
60
61
62
63
64
65
66
67
68
69
70
71
72
73
74
75
76
77
78
79
80
81
82
83
84
85
86
87
88
89
90
91
92
93
94
95
96
97
98
99
100
101
102
103
104
105
106
107
108
109
110
111
112
113
114
115
116
117
118
119
120
121
122
123
124
125
126
127
128
129
130
131
132
133
134
135
136
137
138
 
InIndicator 	= Status( "Action" ) == 1;
StaticVarKey 	= GetChartID();
 
procedure xStaticVarSet( SName, SValue )
{
    global StaticVarKey;
 
    if ( InIndicator )
        StaticVarSet( Sname + StaticVarKey, Svalue );
}
 
function xStaticVarGet( SName )
{
    global StaticVarKey;
    return StaticVarGet( Sname + StaticVarKey );
}
 
procedure xStaticVarSetText( SName, SValue )
{
    global StaticVarKey;
 
    if ( InIndicator )
        StaticVarSetText( Sname + StaticVarKey, Svalue );
}
 
function xStaticVarGetText( SName )
{
    global StaticVarKey;
    return StaticVarGetText( Sname + StaticVarKey );
}
 
function DateNumToStr( DtNum )
{
    DayNm = round( frac( DtNum / 100 ) * 100 );
    MthNm = round( frac( DtNum / 10000 ) * 100 );
    YrNm = int( DtNum / 10000 ) + 1900;
    return NumToStr( MthNm, 1.0 ) + "/" + NumToStr( DayNm, 1.0 ) + "/" + NumToStr( YrNm, 1.0, False );
}
 
procedure TWSBackupTradeList( TWSInputPath )
{
    global TradebackupFolder, AccountType;
    fh1 = fopen( TWSInputPath, "r" );
 
    if ( fh1 )
    {
        Line 				= StrReplace( fgets( fh1 ), ";", "," );
        DateStr 			= StrExtract( Line, 5 );
        YearNum			= StrToNum( StrLeft( DateStr, 4 ) );
        MonthNum			= StrToNum( StrMid( DateStr, 4, 2 ) );
        DayNum			= StrToNum( StrRight( DateStr, 2 ) );
        DateNumber 		= ( YearNum - 1900 ) * 10000 + 100 * MonthNum + DayNum;
        DateNumStr 		= NumToStr( DateNumber, 1.0, False );
        BackupFilename = AccountType + DateNumStr + ".csv";
        BackupPath 		= TradebackupFolder + BackupFilename;
        fclose( fh1 );
    }
 
    fh1 = fopen( TWSInputPath, "r" );
 
    fdelete( BackupPath );
    fh2 = fopen( BackupPath, "a" );
    LineNum = 0;
    TWSTradeList = CSVTradelist = "";
 
    if ( fh1 )
    {
        if ( fh2 )
        {
            while ( ! feof( fh1 ) )
            {
                Line = fgets( fh1 );
                TWSTradeList = TWSTradeList + Line;
                Line = StrReplace( Line, ";", "," );
                CSVTradelist = CSVTradelist + Line;
                LineNum++;
 
                if ( Line != "" )
                {
                    fputs( Line, fh2 );
                }
            }
        }
 
        xStaticVarSetText( "TWSTradelist", TWSTradelist );
 
        xStaticVarSetText( "CSVTradelist", CSVTradelist );
    }
    else
    {
        if ( fh1 == 0 )
        {
            PopupWindow( "Could NOT Open InputPath: " + TWSInputPath,
                         "TWS EXPORTED TRADELIST", timeout = 5, left = -1, top = -1 );
        }
 
        if ( fh2 == 0 )
        {
            PopupWindow( "Could not open OutputPath: " + OutputPath,
                         "TWS EXPORTED TRADELIST", timeout = 5, left = -1, top = -1 );
        }
    }
 
    if ( fh1 )
        fclose( fh1 );
 
    if ( fh2 )
        fclose( fh2 );
 
    Caption = "TWS EXPORTED TRADELIST";
 
    Message = "The TWS Tradelist: \n   " + TWSInputPath + " [" + NumToStr( LineNum, 1.0, False ) +
              " Trades/" + DateNumToStr( DateNumber ) + "]" +
              " \nHas been saved in csv format as:\n   " + BackupPath;
 
    PopupWindow( Message, Caption, timeout = 20, left = -1, top = -1 );
}
 
_SECTION_BEGIN( "BACKUP TWS TRADELIST" );
TWSInputPath				= ParamStr( "TWS Tradelist (Folder)", "C:\\Jts\\" );
AccountType					= ParamList( "TWS Account Type (Filename)", "Real|Simulated|Demo", 1 );
TWSInputFilename			= AccountType + ".Trades";
TWSInputPath 				= TWSInputPath + TWSInPutFilename;
TradebackupFolder			= ParamStr( "Backup Destination Folder", "C:\\Jts\\TWSTrades\\" );
BackupTWSTradeList		= ParamTrigger( "Create Backup Tradelist", "BACKUP" );
ShowTWSTradeList			= ParamToggle( "TWS Tradelist", "HIDE|SHOW", 1 );
ShowCSVTradeList			= ParamToggle( "CSV Tradelist", "HIDE|SHOW", 1 );
_SECTION_END();
 
if ( BackupTWSTradeList )
    TWSBackupTradeList( TWSInputPath );
 
TWSStr = WriteIf( ShowTWSTradeList, "\nTWS Exported Tradelist: \n" + xStaticVarGetText( "TWSTradelist" ) + "\n", "" );
 
CSVStr = WriteIf( ShowCSVTradelist, "\nCSV Exported Tradelist: \n" + xStaticVarGetText( "CSVTradelist" ), "" );
 
Title = TWSStr + CSVStr;

Edited by Al Venosa.

1 Star2 Stars3 Stars4 Stars5 Stars (2 votes, average: 4.00 out of 5)
Loading ... Loading ...

Real-Time Bar Period Timing

When trading in real-time, one often needs to know when a new period starts and how much time there is left before the period ends. The code below will give you the time remaining to the next bar, the time elapsed since the start of the bar, and the second count since date-change. The timing values will automatically adjust to the selected chart interval. You can use the variables in your system’s code to time various events.

This code is shown in a demo configuration, and you will have to adapt it to your personal requirements. To test, simply Apply the code to an Indicator window. For a quick test, select the one-minute time interval.

1
2
3
4
5
6
7
8
9
10
11
12
13
14
15
16
17
18
19
20
21
22
23
24
25
26
27
28
29
30
31
32
function GetSecondNum()
{
    Time 		= Now( 4 );
    Seconds 	= int( Time % 100 );
    Minutes 	= int( Time / 100 % 100 );
    Hours 	= int( Time / 10000 % 100 );
    SecondNum = int( Hours * 60 * 60 + Minutes * 60 + Seconds );
    return SecondNum;
}
 
RequestTimedRefresh( 1 );
TimeFrame = Interval();
SecNumber = GetSecondNum();
Newperiod = SecNumber % TimeFrame == 0;
SecsLeft	 = SecNumber - int( SecNumber / TimeFrame ) * TimeFrame;
SecsToGo	 = TimeFrame - SecsLeft;
 
if ( NewPeriod )
{
    Say( "New period" );
    Plot( 1, "", colorYellow, styleArea | styleOwnScale, 0, 1 );
}
 
Title = "\n" +
 
        "  Current Time: " + Now( 2 ) + "\n" +
        "Chart Interval: " + NumToStr( TimeFrame, 1.0 ) + " Seconds\n" +
        " Second Number: " + NumToStr( SecNumber, 1.0, False ) + "\n" +
        "  Seconds Left: " + NumToStr( SecsLeft, 1.0, False ) + "\n" +
        " Seconds To Go: " + NumToStr( SecsToGo, 1.0, False );
 
Plot( C, "", 1, 128 );

For verification, timing is displayed in the chart title:

clip_image002

Edited by Al Venosa.

1 Star2 Stars3 Stars4 Stars5 Stars (4 votes, average: 4.50 out of 5)
Loading ... Loading ...

Real-Time Bar-Period Timing

In real-time trading one often needs to know when a new period starts and how much time there is left before the period ends. The code below provides this information. Be sure to synchronize your system’s clock.

1
2
3
4
5
6
7
8
9
10
11
12
13
14
15
16
17
18
19
20
21
22
23
24
25
26
27
function GetSecondNum() 
{ 
Time = Now(4); 
Seconds = int(Time%100); 
Minutes = int(Time/100%100); 
Hours = int(Time/10000%100); 
SecondNum= int(Hours*60*60+Minutes*60+Seconds); 
return SecondNum; 
} 
 
RequestTimedRefresh(1); 
TimeFrame = Interval(); 
SecNumber = GetSecondNum(); 
Newperiod = SecNumber%TimeFrame == 0; 
SecsLeft = SecNumber-int(SecNumber/TimeFrame)*TimeFrame; 
SecsToGo = TimeFrame - SecsLeft; 
if( NewPeriod )  
{ 
Say("New period"); 
Plot(1,"",colorYellow,styleArea|styleOwnScale,0,1); 
} 
Title = "\n"+ 
"time: "+Now(2)+"\n"+ 
"Interval: "+NumToStr(TimeFrame,1.0)+"\n"+ 
"Second Number: "+NumToStr(SecNumber,1.0,False)+"\n"+ 
"Seconds Left: "+NumToStr(SecsLeft,1.0,False)+"\n"+ 
"Seconds To Go: "+NumToStr(SecsToGo,1.0,False);

For testing and code verification timing is displayed in the chart title:

clip_image002

1 Star2 Stars3 Stars4 Stars5 Stars (6 votes, average: 4.00 out of 5)
Loading ... Loading ...

High-Frequency Automated Trading (HFAT); part 2

Interactive Brokers’ Real-Time Volume Data

Just like with price data, volume data are subject to delays and BF (Backfill) corrections. Moreover, IB (Interactive Brokers) reports volume data in a manner that could cause major performance differences between backtesting and actual trading.

This post outlines simple procedures to collect RT and BF data for comparison. No effort is made to explain the differences or to perform statistical analysis. The views expressed here are based on personal experiences and/or may be anecdotal; not everything that happens in real-time trading is easy to explain. As always, if you have technical insight and/or see inaccuracies, please comment for the benefit of future readers.

As expected, IB RT volume data contain the usual bad ticks and delays that are corrected during backfill. However, and this is very important to the RT trader, IB adjusts live volumes at about 30-second intervals. This means that the volumes IB reports during RT trading do not accurately reflect market activity. This means also that volume data may be delayed by up to 30 seconds, instead of by the typical snapshot delay, which is about 300 milliseconds for price data. Comparing backfilled with real-time volume, it appears that the real-time periodic volume adjustments are re-distributed across individual snapshots during backfill. This post is intended to help you perform your own data analysis. The methods outlined below are intended to get you started.

To collect and save real-time data:

  1. Create a new database in the 5-second interval.
  2. Embed “RD”, for Raw Data, when naming the database.
  3. In Database Settings select the Interactive Brokers plugin.
  4. Pick a high volume stock, for example, AAPL (used in this post).
  5. Connect to the TWS (Trader Work Station), signing in to your Paper Trading account. Do not use the eDemo account.
  6. Collect about an hour’s worth of real-time data.

The first thing that will happen when you connect to the TWS is that AmiBroker backfills approximately 2000 bars of 5-second data. This cannot be prevented and you must be careful to note the time where backfill ends and raw data collection starts. The simplest way is to place a vertical line on your chart and label it “Start of real-time data”.

To save the database:

  1. Disconnect the IB plugin (see Plugin menu at right bottom of chart).
  2. Open Database Settings and set the database to Local.
  3. Place another vertical line to indicate where data collection stopped.
  4. Go to the File menu and save the database.

Be sure to set the Database Settings -> Data Source -> Local before saving. If you do not do this the database will backfill on the next startup and this may corrupt your RT data sample.

The next step is to collect a sample of BF data that overlaps the previously collected real-time sample. To do this, you need to create another database. Since IB backfills only about 2000 bars of 5-second data, you should do this as soon as possible after collecting raw data, else the collection periods may not overlap and you will not be able to compare the two types of data. The procedure is the same as above except that you want to embed “BF” (for backfilled data) instead of “RD” in the database name.

To visually compare the two databases you can open two instances of AmiBroker and load the RT database in one and the BF database in the other. You can then display the two databases at the same time and visually compare the respective charts. You may want to display both a price chart and a volume chart in separate panes, as shown in the captures below.

You can use the code below to inspect your price chart:

1
2
3
4
5
6
Plot(C,"Close",colorBlack,styleBar); 
TN=TimeNum(); 
Cursortime = SelectedValue(TN); 
CumHL = Cum(IIf(TN>=CursorTime,H-L,0)); 
Plot(CumHL,"",4,styleArea|styleOwnScale); 
Title=Name()+" Interactive Brokers BackFilled price data - "+Interval(2);

And this code to inspect your Volume chart:

1
2
3
4
5
6
Plot( Volume,"",2,styleOwnScale|styleHistogram|styleThick); 
TN=TimeNum(); 
Cursortime = SelectedValue(TN); 
CV = Cum(IIf(TN>=CursorTime,V,0)); 
Plot(CV,"",4,styleArea); 
Title="Backfilled Volume data - "+Interval(2);

The above formulas will display basic charts plus a cumulative value (red area) for any parameter you would like to test. In the price chart, high-low range (H-L) is summed while in the Volume chart plain Volume is summed. Summation starts with the cursor-selected bar. This feature is only provided to visually reveal data differences; it has no other significance.

The charts below were created using the above methods, which quickly reveal the difference between the two types of data. To explain why these difference occur is left up to the expert reader (because I don’t have a clue!!).

clip_image002[16]

Figure 1 – Backfilled data

clip_image004[16]

Figure 2 – Real-Time Collected data

The following volume indicator can be used to display the RT volume periodicity more clearly:

1
2
3
4
5
6
7
8
9
10
11
12
13
14
15
16
17
18
19
20
Filename = StrLeft(_DEFAULT_NAME(),StrLen(_DEFAULT_NAME())-2); 
Vref = Ref(HHV(V,4),-1); 
VSpike = V > Vref AND V>Ref(VRef,-1)/2; 
BS=ValueWhen(VSpike,BarsSince(Ref(VSpike,-1))+1); 
Plot(V,"",2,styleHistogram); 
Plot(IIf(Vspike ,V,Null),"",1,styleArea); 
FirstVisibleBar = Status( "FirstVisibleBar" ); 
Lastvisiblebar = Status("LastVisibleBar"); 
TN=DateTime(); 
S=Second(); 
for( b = Firstvisiblebar; b <= Lastvisiblebar AND b < BarCount; b++) 
{ 
if(VSpike[b]) PlotText( 
"\n"+NumToStr(V[b]/100*Interval(),1.0,False)+ 
"\n"+NumToStr(BS[b],1.0,False)+ 
"\n"+NumToStr(S[b],1.0,False),b,V[b],2); 
} 
Title = "\nInteractive Brokers "+Filename + " - Display Raw data in 5-Second time frame\n"+ 
"Histogram labeling:\n"+ 
" Volume/100\n Barssince last Volume update\n Second Timestamp";

This code produced the next two charts below. A simple spike filter (see the VSpike definition in the code) is used to identify Volume spikes and make them stand out with a Black background. Since these volume spikes do not appear in backfilled data, we can assume that they do not reflect true market activity. The three numbers at the top of the histogram bars, from the top down, show the Volume/100, number of bars since the last volume spike, and the Second count derived from the data time stamp.

clip_image006[16]

Figure 3 – Real-time collected volume data

Applying the code on backfilled data produces the chart below. Note that many of the low volume periods between the spikes have been filled in (it appears that the volume spikes have been retroactively distributed) and that there is no longer any visible volume periodicity.

clip_image008[16]

Figure 4 – Backfilled volume data

Comparing Data from different Databases

You can compare data from different databases in a single chart. Overlaying two data arrays will immediately reveal differences and will also suggest more sophisticated analysis to be performed. The code below can be executed by itself, or it can be appended to any other program. In this case it is coded for Volume comparison. However, you can easily modify it to compare price, indicators, or any other array. The SetBarsRequired() statement is necessary for data alignment. You must use the same timeframe for both RT and BF charts and for composite creation. All tests in this post were performed in the 5 second timeframe.

1
2
3
4
5
6
7
8
9
10
11
12
13
14
15
16
17
18
19
function StaticVarArraySet( Varname, array ) 
{ 
AddToComposite( array, "~SA_"+VarName, "C", atcFlagDefaults | atcFlagEnableInBacktest | atcFlagEnableInExplore | atcFlagEnableInIndicator | atcFlagEnableInPortfolio ); 
} 
function StaticVarArrayGet( VarName ) 
{ 
return Foreign("~SA_"+VarName,"C"); 
} 
SetBarsRequired(1000000,1000); 
GraphZOrder = 1; 
StaticArrayName = ParamList("Static Array Name","RawDataSample|BackfillDataSample",0); 
if(ParamTrigger("Create Volume Composite","CREATE") ) 
{ 
StaticVarArraySet( StaticArrayName, V); 
} 
if( ParamToggle("Overlay Composite","NO|YES",0) ) 
{ 
Plot(StaticVarArrayGet( StaticArrayName),"",colorYellow,styleStaircase); 
}

To compare BF with RT volume arrays, you first create the composite for the BF volume and copy this to your RT database for comparison. The procedure is as follows:

  1. Load up the database containing your BF data sample.
  2. Display the data and open the Param window:

clip_image010[16]

  1. Select BackFillDataSample for static variable name.
  2. Click CREATE.
  3. In the Amibroker menu bar, click View -> Refresh All.
  4. In the Indicator window, set Overlay Composite to YES. The composite data should display as a Yellow staircase superimposed on your volume chart.
  5. Close AmiBroker.
  6. Use Windows Explore to find your BF database and copy the composite for BF volume from the “_” folder and paste it into the “_” folder of the RT database.
  7. Delete the Broker.Master file from the RT database. This file will be recreated at next startup. This step is needed to include the new composite file in the database index.
  8. Start up AmiBroker and load up the RT database.
  9. Display the RT volume chart you were working with. If the Parameters are set as shown in the capture above you should now see the Yellow staircase for BF Volumes superimposed on the RT volume histogram.

At this point you can scroll back and forth in time to see how BF volume differs from RT collected volume. Do not click CREATE, or you will overwrite the BF composite. The charts below show what your charts should look like.

clip_image012[16]

Figure 5 – BF composite (Yellow) on BF Volume Histogram

Figure 5 above shows a period where the composite covered backfilled volume (for example the backfill period before RT collection). Because the composite copied this BF data, they match perfectly.

clip_image014[16]

Figure 6 – BF Composite (Yellow) on RT collected Volume Histogram

Figure 6 above is for a period where the composite (backfilled volume) is superimposed on the real-time collected volume (histogram). Note the difference between the two types of data.

Developing a trading system should start with learning about the basics; delays and bad data quality can kill any HFAT trading system no matter how much time you spent developing it. The best way to understand and know what you are working with is to write a few small programs, like those that were included in this series.

Conclusion

In the previous discussions, it became clear that developing an HFAT trading system might not be as easy as you think. Googling for information will reveal very few links to practical information; you’ll be mostly on your own to discover the pitfalls. Developing with live data from your paper-trading account may be better than using backfilled data. However, since it is highly likely that IB executes paper trades subject to the reported price and volume you see, paper-trading results may not match actual trading results. Unless you are acutely aware of the various problems and can develop your system to work around them, it would appear futile to try and develop an HFAT trading system with 5-second IB data. The unique real-time volume patterns also occurred in data collected from the real-trading account.

Data from all sources will have their own unique problems, and it is prudent to perform some basic testing to get to know your RT data before spending considerable time on development.

Note

IB Snapshots and data compression methods are relevant to the above discussion; even though there isn’t much detail available, you may want to read the following threads to learn more about these topics.

AmiBroker user group: Interactive Brokers Plug-in dropping volume data
IB’s Discussion Board: Globex Ticks snapshot or reality?
AmiBroker User Group: AB Tick Bar Analysis

Edited by Al Venosa.

1 Star2 Stars3 Stars4 Stars5 Stars (5 votes, average: 4.80 out of 5)
Loading ... Loading ...
« Previous PageNext Page »