Logging and displaying trades

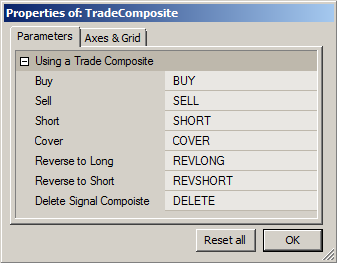
In real trading it is desirable to use a persistent trade record so that trades for multiple sessions be analyzed using the Backtester. The easiest way to do this is to save the trades in a composite. The code shown below is a simplified version of what will be used in the TDash system, however, it can be used with any trading system. This code requires you set Preferences -> Intraday -> “Time of first tick inside bar” or “START time of interval”. Apply the code to an empty pane, start Bar-Replay, and open the Parameter window. After placing some trades you can send the code to the Backtester for analysis. You can perform the following actions:

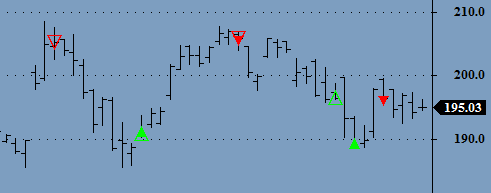
I use small solid triangles for Buy and Sell signals, and hollow triangles for Short and Cover signals. This allows me to overlay the Buy and Cover signals, and the Sell and Short signals, to display trade reversals. The triangles are placed at the actual trading price (the Close in this example). This is what the arrows look like:

_SECTION_BEGIN"USING A TRADE COMPOSITE" );
function DeleteCompositeCompositeName )
{
    global Ticker;
    oAB CreateObject"Broker.Application" );
    oStocks oAB.Stocks();
    oStocks.RemoveCompositeName );
    oAB.RefreshAll();
}

function  AddTradeToCompositeTickerActionLMTPrice )
{
    global Ticker;
    BI  BarIndex();
    LBI LastValueBI );

    if ( Action != "" )
    {
        SignalArray NzForeignTicker "~SignalArrays""V"False ) );
        BuyPriceArray NzForeignTicker "~SignalArrays""O"False ) );
        SellPriceArray NzForeignTicker "~SignalArrays""H"False ) );
        ShortPriceArray NzForeignTicker "~SignalArrays""L"False ) );
        CoverPriceArray NzForeignTicker "~SignalArrays""C"False ) );

        switch ( Action )
        {

            case "BUY":
                SignalArray[LBI] = SignalArray[LBI] | 1;
                BuyPriceArray[LBI] = LMTPrice;
                break;

            case "SELL":
                SignalArray[LBI] = SignalArray[LBI] | 2;
                SellPriceArray[LBI] = LMTPrice;
                break;

            case "SHORT":
                SignalArray[LBI] = SignalArray[LBI] | 4;
                ShortPriceArray[LBI] = LMTPrice;
                break;

            case "COVER":
                SignalArray[LBI] = SignalArray[LBI] | 8;
                CoverPriceArray[LBI] = LMTPrice;
                break;

            case "REVLONG":
                SignalArray[LBI] = SignalArray[LBI] | 1;
                CoverPriceArray[LBI] = BuyPriceArray[LBI] = LMTPrice;
                break;

            case "REVSHORT":
                SignalArray[LBI] = SignalArray[LBI] | 4;
                SellPriceArray[LBI] = ShortPriceArray[LBI] = LMTPrice;
                break;
        }

        AddToCompositeSignalArrayTicker "~SignalArrays""V"atcFlagEnableInIndicator );
        AddToCompositeBuyPriceArrayTicker "~SignalArrays""O"atcFlagEnableInIndicator );
        AddToCompositeSellPriceArrayTicker "~SignalArrays""H"atcFlagEnableInIndicator );
        AddToCompositeShortPriceArrayTicker "~SignalArrays""L"atcFlagEnableInIndicator );
        AddToCompositeCoverPriceArrayTicker "~SignalArrays""C"atcFlagEnableInIndicator );
    }
}

Ticker Name();
Action "";

if ( ParamTrigger"Buy""BUY" ) ) Action "BUY";
if ( ParamTrigger"Sell""SELL" ) ) Action "SELL";
if ( ParamTrigger"Short""SHORT" ) ) Action "SHORT";
if ( ParamTrigger"Cover""COVER" ) ) Action "COVER";
if ( ParamTrigger"Reverse to Long""REVLONG" ) ) Action "REVLONG";
if ( ParamTrigger"Reverse to Short""REVSHORT" ) ) Action "REVSHORT";
if ( ParamTrigger"Delete Signal Compoiste""DELETE" ) ) DeleteCompositeTicker "~SignalArrays" );
AddTradeToCompositeTickerActionLastValueClose ) );

RequestTimedRefresh0.1 );
if ( SetForeignTicker "~SignalArrays" ) )
{
    SignalArray    NzForeignTicker "~SignalArrays""V"False ) );
    Buy         IIfSignalArray 11);
    Sell         IIfSignalArray 21);
    Short         IIfSignalArray 41);
    Cover         IIfSignalArray 81);

    BuyPrice     NzForeignTicker "~SignalArrays""O" ) );
    SellPrice     NzForeignTicker "~SignalArrays""H" ) );
    ShortPrice    NzForeignTicker "~SignalArrays""L" ) );
    CoverPrice     NzForeignTicker "~SignalArrays""C" ) );

    PlotShapesIIfBuyshapeSmallUpTriangleshapeNone ), 50BuyPrice);
    PlotShapesIIfSellshapeSmallDownTriangleshapeNone ), 40SellPrice);
    PlotShapesIIfShortshapeHollowDownTriangleshapeNone ), 40ShortPrice);
    PlotShapesIIfCovershapeHollowUpTriangleshapeNone ), 50CoverPrice);

}
RestorePriceArrays();

PlotC""1128 );
_SECTION_END();

Quick-Order Bar (QBar)

Because the project has now reached a stage where it requires the Control panel to function, I have not included demo code at this time. The Control panel will be covered in one of the next posts and, when that is up and running, it will be easier to test most of the features of the TDash Graphical Interface.

The QBar is a small tool bar that tracks the Y-position of the cursor. It is designed for fast real-time trading and has only three buttons: Buy, Sell, and Reverse. You can add/delete buttons, for example, you could add a button to Cancel the last order placed. Order parameters are set in the Control panel.

The main advantage of the QBar is that you can place an order with a single-click. You do not have to move your eyes away from the last bar on your chart to place the order, you simply move your mouse cursor to the required price and click.

The QBar and the Order Markers share some functionality. The main difference is that the QBar is designed for placing new orders, and that the Order Markers are designed to display and modify pending orders.

The QBar has two display modes:

  1. Auto-Hide Off. The QBar displays continuously. When the cursor moves out of the QBar area the QBar remains in its last position.
  2. Auto-Hide ON. The QBar displays only when the cursor is in the Qbar area, i.e., in the vertical column space reserved for the QBar. When the cursor leaves the QBar area, it remains positioned at the last price selected. This mode allows the display of trade and system information in the QBar area when the QBar is auto-hidden.

The QBar also has an “Auto Modify” mode. When this is turned on you can place an order and, holding down the left mouse button, drag the QBar to a new price. As long as you keep the mouse button down the order on the TWS will be modified, in real-time, each time the price changes.

Below is a short video that shows what the QBar looks like. I removed the Order markers while working on the QBar.

Processing TDash Commands

If you watched the small video in earlier post on Order Markers you may have noticed that whenever the mouse cursor hovered over, or a mouse button was clicked while over an Order Marker, the “TDashAction” variable shown at the right top of the video changed. This is a unique variable that is solely responsible for communicating TDash Action to the Auto-Trading module. This method allows TDash to be linked to your current trade automation module. This post explains how this works.

Because the cursor can only be in one location at a time, all TDash commands are exclusive. Hence we do not need to assign individual names to each parameter, instead we can use a single string variable to tell us the name of the button and action performed. Compared to using traditional Param()s, where each Param() assigns a value to a unique variable, this eliminates about 50-100 variable names, and allows us to use a single Switch() command to process the commands. It also makes code easier to read, modify, and maintain.

To make this work requires that buttons are organized as follows:

  1. Buttons are assigned to uniquely named groups like “Markers”, “Menus”, “Trading”, “Setup”, “Account”, “Status”, etc. For example, the Order Markers covered in the previous post would fall in the “Marker” group, the forthcoming QBar controls will fall in the “QBar” group, etc.
  2. All buttons must have an upper “Header”, and may have an optional lower “Label”. The visible header and label is unique to the group it belongs to. A typical example would be a Buy @ LMT button, “Buy” would be the Header, and “LMT” would be the lower Label. In this case the lower label may take on different values, such as “MKT”, “STP”, and “STPLMT”. Header-only buttons are typically used for trigger functions which have no changing state to display, for example “Reset” or “Abort” buttons.
  3. Since all buttons respond to mouse movement and button clicks, buttons can have four possible possible action states:
      Hover: the cursor hovers over the button
      LeftClick: the left button is clicked while the cursor is over the button
      LeftDown: the left button is held down while the cursor is over the button (Dragging)
      LeftRelease: The left button is released while over the button

These four action states are encoded by prefixing a “~” for a Leftclick, “~~” for a LeftDown condition, and “~~~” for the LeftRelease. Concatenating the action prefix, group name, visible header string, and visible Label string into a csv string provides us with a “TDashAction” string that uniquely defines the button and its transient states. Because for multi-state buttons the lower label describes the state of the button, this string also tells us the state of the button. For additional clarity we can also change the button-color to indicate its state.

For example, dragging the Buy Order Marker shown in the previous post would, over consecutive executions, generate the following sequence of changes in the TDashAction variable:

    Marker,Buy // cursor hovers over the button
    ~Marker,Buy // left-click on the button is detected
    ~~Marker,Buy // the left mouse button is down on the button (dragging)
    ~~~Marker,Buy // the left mouse button is released while over the button

This type of encoding is used for all TDash buttons and controls. While this method may be a little esoteric it makes reading the code very easy, and allows us to add controls without having to dream up a new set of variable names. We just look at the displayed TDashAction string and we know the name for the action to be decoded in our Switch().

This method makes decoding TDash action using a switch() simple and easy to debug. Note that in most cases not all possible states need a case statement. A major advantage of using a Switch() statement is that one can, at any time, easily add and/or remove buttons.

Below is a simple Switch(0 to decode the “Marker Buy” command used in the previous post:

TDashAction =  VarGetText"TDashAction" );

switch ( TDashAction )
{

case "Marker,Buy":
    // perform tasks in response to hovering over the Marker
    _TRACE"TDashAction: " TDashAction );
    break;

case "~Marker,Buy":
    // Perform action in response to a left click on the Marker
    _TRACE"TDashAction: " TDashAction );
    break;

case "~~Marker,Buy":
    // React to dragging the marker
    _TRACE"TDashAction: " TDashAction );
    break;

case "~~~Marker,Buy":
    // Perform action in response to releasing the mouse button
    _TRACE"TDashAction: " TDashAction );
    break;
}

Equalize X-Range for all windows

This function was requested on the main list, and was solved with the help of several expert programmers from the list. Thanks guys!

This function can be copied to an include file that is included in each program from which you might want to synchronize the datetime range for all visible windows. The function places a small [R] button at the right top of your chart. Clicking this button will set the datetime ranges of all windows equal to the one you click the button in. Note that this window has to be active for the button to work, i.e., if the window was not active (selected) it will require two clicks for the button to respond.

function RangeAllWindows()
{
    MX GetCursorXPosition);
    MY GetCursorYPosition);
    LeftClick GetCursorMouseButtons() == 9;

    // Place Ranging Button
    ButtonSize=20;
    X2 Status"pxchartright" )+1;
    X1 X2 ButtonSize;
    Y1 0;
    Y2 Y1 ButtonSize;
    GfxSelectFont"Tahoma"ButtonSize 1.5800 );
    GfxSelectPencolorBlack );
    GfxSelectSolidBrushcolorYellow );
    GfxRectangleX1Y1X2Y2 );
    GfxSetTextColorcolorBlack );
    GfxSetBkMode);
    GfxDrawText"R"X1Y1X2Y241 );
    OnButton MX >= X1 AND MY >= Y1 AND MX <= X2 AND MY <= Y2;

    if ( OnButton AND LeftClick )
    {
        DT DateTime();
        BI BarIndex();
        FirstBarIndex Status"firstvisiblebarindex" );
        LastBarIndex Status"lastvisiblebarindex" );
        FirstDateTime LastValueValueWhenFirstBarIndex == BIDT ) );
        LastDateTime LastValueValueWhenLastBarIndex == BIDT ) );
        FirstDateTimestr DateTimeToStrFirstDateTime );
        LastDateTimestr DateTimeToStrLastDateTime );
        AB CreateObject"Broker.Application" );
        docs AB.Documents;
        Qty docs.Count;

        for ( 0Qtyi++ ) // Range all windows
        {
            doc docs.Item);
            AW doc.ActiveWindow;
            AW.Activate();
            AW.ZoomToRangeFirstDateTimestrLastDateTimestr );
            // correct shift due to blank bars
            WSHShell CreateObject"WScript.Shell" );
            WSHShell.AppActivate"AmiBroker" );
            WSHShell.Sendkeys"{PGDN}" );
        }
    }
}

//Demo Code
RangeAllWindows();
Plot(C,"",1,128);

Introducing Order Markers

In the previous post I developed a method to link prices between the TDash window and the Main Chart window. In this post I show how I used this technique to develop “Order Markers” that can be used to modify orders, display order status, and cancel orders.

In the final TDash Order Markers will be created automatically whenever an order is found Pending. The initial orders will be placed with another tool (the QBar) that will be covered in a subsequent post.

To test the Order markers you need to create two side-by-side windows in AmiBroker. If you use multiple monitors you can place the Main Chart at the right side of the left monitor, and TDash on left side of the right monitor. This will work fine and gives you a lot of space to work with. However, depending on the monitor sizes and their horizontal positions, the Markers may not appear perfectly at the same height from your desk, however the prices shown and plotted will be accurate.

To install the programs, first open and copy this TDashInclude.afl include file (not listed below due to its size) to the AmiBroker default Include folder. The TDashInclude.afl file is a development version and contains a lot of code that you don’t need at this time – please ignore the unused functions. The include will be cleaned up when the functions all work as they should. Next Apply MainMarkers.afl (listed below) to the main chart at the left, and Apply TDashMarkers.afl (listed below) to the TDash window at the right.

The demo code presented here creates three Order Markers, each can be moved by dragging it to a new price level. At start-up the Order markers will be parked at the top of the TDash window, just click on them to activate them. Remember that in the final TDash inactive Order Markers will not show, only Order Markers for Pending orders will show.

The price line and value displayed on the main chart will track the Order Marker, and the Order Markers will track a changing Y-axis on the Main chart. To allow setting an exact price Increment (+) and Decrement (-) controls are provided on the Marker. To cancel the order click the Cancel control (X). In this test cancel will only gray-out the marker and park it at the top of the TDash window, in the final program a canceled Marker will disappear after the cancellation has been confirmed.

It should look and work as shown in this video below.

// TDashMainMarkers.afl

PersistentPath StaticVarGetText"~PersistentPath" ); // Global
if ( PersistentPath == "" ) 
{
    PersistentPath "PersistentVariables\\";
    fmkdirPersistentPath );
    StaticVarSetText"~PersistentPath"PersistentPath );
}

function PersistentVarRemoveVarName )
{
    global PersistentPath;
    Fn PersistentPath VarName ".pva";
    fh fdeleteFn ) ;
    return fh;
}

function PersistentVarGetVarName )
{
    global PersistentPath;
    fh fopenPersistentPath VarName ".pva""r" );
    if ( fh )
    {
        String fgetsfh );
        fclosefh );
        Number StrToNum( String );
    }
    else Number Null;
    return Number;
}

function PersistentVarSetVarNameNumber )
{
    global PersistentPath;
    String NumToStrNumber );
    fh fopenPersistentPath VarName ".pva""w" );
    if ( fh )
    {
        fputsStringfh );
        fclosefh );
    }
    return fh;
}

function MAinLinkWitTDashMArkername )
{
    local xMY;
    // On first run try to get persistent price
    if ( IsNullStaticVarGet"~MarkerInit_" MArkerName ) ) )
    {
        Price PersistentVarGet"MainChartPrice_" MarkerName );
        if ( Price )
        {
            Miny Status"axisminy" );
            Maxy Status"axismaxy" );
            PxChartRange Status"pxchartheight" );
            Pricerange MaxY MinY;
            TDashYPixels = ( MaxY Price ) * PxChartRange Pricerange 5;
            StaticVarSet"~TDashYPixels_" MarkerNameTDashYPixels );
            StaticVarSet"~MainChartPrice_" MarkerNamePrice );
            StaticVarSet"~Exists_" MarkerNameTrue );
        }
        StaticVarSet"~MarkerInit_" MArkerNameTrue );
    }

    MArkerEnabled NzStaticVarGet"~Exists_" MarkerName ) );
    if ( MArkerEnabled )
    {
        pxWidth Status"pxWidth" );
        Miny Status"axisminy" );
        Maxy Status"axismaxy" );
        pxchartright Status"pxchartright" );
        pxchartbottom Status"pxchartbottom" );
        pxcharttop Status"pxcharttop" );
        PxChartRange Status"pxchartheight" );
        pxheight Status"pxheight" );
        Pricerange MaxY MinY;

        // TDash releases get TDash y-pixel value and convert to price
        if ( NzStaticVarGet"~LeftButtonRelease" ) ) )         
        {
            TDashYPixels NzStaticVarGet"~TDashYPixels_" MarkerName ) );        // Y pixels from TDash window
            Price Maxy - ( Pricerange PxChartRange * ( TDashYPixels ) );
            StaticVarSet"~LeftButtonRelease"False );
            StaticVarSet"~MainChartPrice_" MarkerNamePrice );
        }
        else
            if ( NzStaticVarGet"~NowDragging_" MarkerName ) ) == )     // TDash marker tracks main window
            {
                Price NzStaticVarGet"~MainChartPrice_" MarkerName ) );
                TDashYPixels = ( MaxY Price ) * PxChartRange Pricerange 5;
                StaticVarSet"~TDashYPixels_" MarkerNameTDashYPixels );         // Y pixels calculated from price in main chart
            }
            else
                if ( NzStaticVarGet"~NowDragging_" MarkerName ) ) )             // Main window tracks TDash window
                {
                    TDashYPixels NzStaticVarGet"~TDashYPixels_" MarkerName ) );
                    Price Maxy - ( Pricerange PxChartRange * ( TDashYPixels ) );
                    StaticVarSet"~MainChartPrice_" MarkerNamePrice );  // Price for main chart calculated from TDash y pixels
                }

        Price NzStaticVarGet"~MainChartPrice_" MarkerName ) );

        MArkerColor  NzStaticVarGet"~MarkerColor_" MarkerName ) );
        MArkerTextColor NzStaticVarGet"~MarkerTextColor_" MarkerName ) );
        MArkerPenColor NzStaticVarGet"~MarkerPenColor_" MarkerName ) );

        GfxSetBkMode);
        GfxSelectPenMArkerColor1);
        GfxMoveTo0TDashYPixels );
        GfxLineTopxwidthTDashYPixels );

        GfxSetBkMode);
        GfxSetBkColorMArkerColor );
        GfxSetTextColorMArkerTextColor );
        GfxSelectFont"Lucida Console"FontSize 10FontWeight 700 );
        GfxDrawTextNumToStrPrice1.2False ), pxchartrightTDashYPixels FontSizepxwidthTDashYPixels Fontsize37 );
    }
}

function DrawQBarPriceLine()
{
    if( NzStaticVarGet"~QBarVisible" ) ) )
    {
        pxWidth Status"pxWidth" );
        Miny Status"axisminy" );
        Maxy Status"axismaxy" );
        pxchartright Status"pxchartright" );
        pxchartbottom Status"pxchartbottom" );
        pxcharttop Status"pxcharttop" );
        PxChartRange Status"pxchartheight" );
        pxheight Status"pxheight" );
        Pricerange MaxY MinY;

    QBarColor  NzStaticVarGet"~QBarColor" ) );
    QBarTextColor NzStaticVarGet"~QBarTextColor" ) );
    QBarPenColor NzStaticVarGet"~QBarPenColor" ) );

    QBarColor NzStaticVarGet"~ActionColor" ) );
    QBarTextColor NzStaticVarGet"~ActionTextColor" ) );

    QBarYPixel NzStaticVarGet"~QBarYPixel" ) );        // Y pixels from TDash window
    Price Maxy - ( Pricerange PxChartRange * ( QBarYPixel ) );
    GfxSetBkMode);
    GfxSelectPenQBarColor1);
    GfxMoveTo0QBarYPixel );
    GfxLineTopxwidthQBarYPixel );

    GfxSetBkMode);
    GfxSetBkColorQBarColor );
    GfxSetTextColorQBarTextColor );
    GfxSelectFont"Lucida Console"FontSize 10FontWeight 700 );
    GfxDrawTextNumToStrPrice1.2False ), pxchartrightQBarYPixel FontSizepxwidthQBarYPixel Fontsize37 );
    }
}


_SECTION_BEGIN"Global Parameters" );
if ( ParamTrigger"Clear StaticVar (TEST)""CLEAR" ) ) // to simulate start up
{
    StaticVarRemove"*" );
}

if ( ParamTrigger"Clear Persistent Var""CLEAR" ) ) // to simulate start up
{
    PersistentVarRemove"MainChartPrice_" "TARGET" );
    PersistentVarRemove"MainChartPrice_" "MAIN" );
    PersistentVarRemove"MainChartPrice_" "STPLOSS" );
}
_SECTION_END();

GfxSetOverlayMode);
MAinLinkWitTDash"BUY" );
MAinLinkWitTDash"MAIN" );
MAinLinkWitTDash"SELL" );
DrawQBarPriceLine();
PlotC""colorBlackstyleBar );
RequestTimedRefresh0.1 );
// TDashMarkers
#pragma nocache
#include <TDashInclude.afl>

_SECTION_BEGIN"TDASH MARKERS" );
setBackGroundColorParamColor"TDash background"colorLightBlue ) );

// Set default font size
FontSize NzStaticVarGet"~FontSize" ) );
FontName "ARIAL";
Fontweight 700;
GfxSelectFontFontNameFontSizeFontWeight );

// Columns. Most parameters are for experimentation and can be hard-coded
NumberCols Param"Number Button Columns"8120);
ButtonWidth Status"pxwidth" ) / NumberCols;
MaxButtonWidth Param"Max Button Width"1501500);
ButtonWidth MinButtonWidthMaxButtonWidth );
MaxMarkerWidth Param"Max Button Width"1501500);
MarkerWidth MinButtonWidthMaxMarkerWidth );

// Rows
NumberRows Param"Number Button Rows"20150);
ButtonHeight Status"pxheight" ) / NumberRows;
MaxButtonHeight Param"Max Button Height"501100);
ButtonHeight MinButtonHeightMaxButtonHeight );
MinButtonHeight Param"Min Button Height"501100);
ButtonHeight MaxButtonHeightMinButtonHeight );

MarkerHeight ButtonHeight;

TipsOn ParamToggle"Help Tips""HIDE|SHOW");
ShowTips ParamToggle"Help Tips""HIDE|SHOW");
ClickSound ParamToggle"Click Sound""OFF|ON");

SetChartOptions0chartHideQuoteMarker );
GfxSetOverlayMode2  );

// mouse
MX GetCursorXPosition);
MY GetCursorYPosition);
LeftClick NzStaticVarGet"~LeftClick" ) ); //Left Click SV set at end of code
LeftDown GetCursorMouseButtons() == 1;

OnTDash     = !IsNullMX ) AND !IsNullMY );
LeftClick LeftClick AND OnTDash;    // Only accept mouse clicks when cursor is inside TDash window
LeftDown = ( LeftDown OR LeftClick ) AND OnTDash;

PrevLeftButtonState NzStaticVarGet"~LeftButtonState" ) );
LeftButtonRelease LeftDown PrevLeftButtonState AND OnTDash;
StaticVarSet"~LeftButtonState"LeftDown ); // Release is also detected outside TDash window

// testing markers
MArkerTip "Drag Price Marker to desired price Level. Click 'X' to cancel, '+' to increment, and '-' to decrement";
ServiceMarkers"TARGET"colorBrightGreencolorBlackcolorBlackMArkerTip );
ServiceMarkers"MAIN"colorBluecolorWhitecolorBlackMArkerTip   );
ServiceMarkers"STPLOSS"colorRedcolorBlackcolorBlackMArkerTip   );

// testing
AddRowTogfxTitle"                TDashAction: "+VarGetText"TDashAction"), colorBlackFontSize=10 );

// The following lines are always located at the end of the code 
ShowTipBrushColor colorYellowOutlineColor colorBlackTextColor colorBlackTipWidth 150TipHeight 1008TipsOn );
LeftClick GetCursorMouseButtons() == 9;
StaticVarSet"~LeftClick"LeftClick );
RequestTimedRefresh0.1 );
_SECTION_END();

Linking the TDash Window with the Main Chart

The most important requirement for a Trading Dashboard is to be able to place orders by dragging price markers and have these prices reflected on your main chart. To accomplish this relationship, the Main Chart and TDash windows must be bi-directionally linked so that changing prices in one window are being tracked in the other.

If both the Main chart and Trading Dashboard window had an identical price range and window size, this could simply be done by sharing the price and pixel ranges using Static Variables. However, to make this work in a multi window layout where windows may not be aligned accurately, or when the TDash window is located on another monitor, is a little more complex.

The problem can be solved by aligning the upper edge of the windows with the upper edge of the AmiBroker window, and use this as the common reference to calculate prices and pixel values.

The code below demonstrates how the Y-Pixel position and prices, between the Trading Dashboard window and the main chart, can be made to track each other. To apply this technique in an actual application you would want to add graphical price markers that you can drag, start up initialization, and provide a fine-adjustment to set prices exactly. Some of this will be covered in the next post.

To test the code, create a two-window Layout, arrange them horizontally, apply the TDashLinkDemo code in the right window, and apply the MainChartLinkDemo code in the left window. Since this test code is not initialized at start-up, you need to click in the TDash window to set an initial price and make the price-line appear.

Click the left mouse button in the TDash window at a new price level to set the price-line to a different value. Click and hold the left mouse button down to drag the price to a new value. Note that the price-line in the main chart window tracks all changes. Price lines would be used to display pending orders and to enable you to set order prices with respect to real-time chart patterns.

When you release the left mouse button in the TDash window it locks in the current price. The only way to change the price is by clicking or dragging it in the TDash window.

If you drag the Y-axis in the main chart the corresponding price-line in the TDash window tracks this movement. This is needed to keep price markers in the TDash window in sync when the main chart y-axis changes.

In a multi-threading environment, where formulas execute asynchronously, we cannot assume that transient conditions saved in a Static Variable in one window will always be detected in another. To ensure reliable mouse-click detection in the Main chart program, the “~LeftButtonRelease” Static Variable, which is set in the control window, is reset in the main chart after it has been detected. This way no triggers will ever be missed.

The short video below illustrates how this works and what it looks like in AmiBroker.

// TDashLinkDemo

function LinkWithMainChart()
{
MX GetCursorXPosition);
MY GetCursorYPosition);
OnTDash = !IsNullMX ) AND !IsNullMY ); // Is cursor in TDash?
LeftClick GetCursorMouseButtons() == AND OnTDash;
LeftDown = ( GetCursorMouseButtons() == OR LeftClick ) AND OnTDash;
PrevLeftDownState NzStaticVarGet"~LeftDown" ) );
LeftButtonRelease LeftDown &ltPrevLeftDownState;
StaticVarSet"~LeftDown"LeftDown );

if ( LeftClick StaticVarSet"~NowDragging"True );
else if ( LeftButtonRelease )
{
StaticVarSet"~NowDragging"False );
StaticVarSet"~LeftButtonRelease"True );
}
if ( NzStaticVarGet"~NowDragging" ) ) ) StaticVarSet"~TDashYPixels"MY );
}

function DrawTDashPriceLine()
{
pxWidth Status"pxWidth" );
TDashYPixels StaticVarGet"~TDashYPixels" );
GfxSetBkMode);
GfxSelectPencolorRed1);
GfxMoveTo0TDashYPixels );
GfxLineTopxwidthTDashYPixels );
}

function TDashDisplayPrice()
{
MY GetCursorYPosition);
TDashYPixles StaticVarGet"~TDashYPixels" );
MAinChartPrice NzStaticVarGet"~MainChartPrice" ) );
GfxSetTextAlign) ;
GfxSelectFont"Lucida Console"12600 );
GfxTextOut"TDash price: $" NumToStrMAinChartPrice1.2False ), 0TDashYPixles );
GfxTextOut"TDash Pixels: " NumToStrTDashYPixles1.0False ), 0TDashYPixles 20 );
}

RequestTimedRefresh0.1 );
GfxSetOverlayMode2);
LinkWithMainChart();
DrawTDashPriceLine();
TDashDisplayPrice(); // Test only

// MainChartLinkDemo

function LinkWithTDash()
{
pxWidth Status"pxWidth" );
Miny Status"axisminy" );
Maxy Status"axismaxy" );
Pricerange MaxY MinY;
pxchartbottom Status"pxchartbottom" );
pxcharttop Status"pxcharttop" );
PxChartRange Status"pxchartheight" );
pxheight Status"pxheight" );

if ( NzStaticVarGet"~LeftButtonRelease" ) ) )
{
TDashYPixels StaticVarGet"~TDashYPixels" );
PricePerPixel Pricerange PxChartRange;
MAinChartPrice Maxy - ( PricePerPixel * ( TDashYPixels ) );
StaticVarSet"~LeftButtonRelease"False );
StaticVarSet"~MainChartPrice"MAinChartPrice );
}
else
if ( NzStaticVarGet"~NowDragging" ) ) == )
{
MAinChartPrice NzStaticVarGet"~MainChartPrice" ) );
PixelPerprice PxChartRange Pricerange;
PriceToPixelvalue = ( MaxY MAinChartPrice ) * Pixelperprice 5;
StaticVarSet"~TDashYPixels"PriceToPixelvalue );
}
}

function DrawTDashPriceLine()
{
pxWidth Status"pxWidth" );
TDashYPixels StaticVarGet"~TDashYPixels" );
GfxSetBkMode);
GfxSelectPencolorRed1);
GfxMoveTo0TDashYPixels );
GfxLineTopxwidthTDashYPixels );
}

function MainDisplayPrice()
{
pxWidth Status"pxWidth" );
TDashYPixels StaticVarGet"~TDashYPixels" );
MAinChartPrice NzStaticVarGet"~MainChartPrice" ) );
GfxSetTextAlign) ;
GfxSelectFont"Lucida Console"12600 );
GfxTextOut"  Main price: $" NumToStrMAinChartPrice1.2False ), pxwidthTDashYPixels );
GfxTextOut"Main Pixels: " NumToStrTDashYPixels1.0False ), pxwidthTDashYPixels 20 );
}

RequestTimedRefresh0.1 );
GfxSetOverlayMode);
LinkWithTDash();
DrawTDashPriceLine();
MainDisplayPrice(); // Test only

PlotC""colorBlackstyleBar );