An unsorted, unqualified list of FAQ’s relating to anything and everything to do with Yahoo! Finance data.
The list is dynamic and subject to change without notice.
Comments, where included, are the opinion of the individuals concerned and are not necessarily correct. In some cases they may be ‘out of date’ as circumstances change with time.
CAUTION – SOME OF THE LINKS CONTAIN COMMERCIAL REFERENCES OR LINK TO COMMERCIAL SITES.
NOTE: THE AUTHOR HAS NO COMMERCIAL AFFILIATIONS OF ANY KIND AND RECEIVES NO GRATUITIES, OR BENEFITS, FROM ANY COMMERCIAL ORGANIZATION OR INDIVIDUAL INVOLVED IN COMMERCIAL ACTIVITIES. NOR IS HE PERSONALLY ENGAGED IN ANY COMMERCIAL ACTIVITIES, RELATED TO TRADING, IN ANY WAY. THE LINKS ARE PROVIDED AS A RESOURCE AND FOR EDUCATIONAL PURPOSES. THEY ARE NOT A RECOMMENDATION, ON THE PART OF THE AUTHOR, NOR DO THEY CONSTITUTE INVESTMENT ADVICE AND SHOULD NOT BE CONSTRUED AS SUCH.
Q7. I want to use Yahoo data for the ASX. Is it accurate?
A7. The use of Yahoo data for ASX stocks is not good.
1. No delisted history – any system testing you do based on Yahoo data is subject to population bias. ie you can only test on the stocks that are currently listed.
2. Significant inaccuracies for any stock exchange that trades in increments less than 1c. This includes the Australian Stock Exchange (ASX), Singapore Exchange, some NASDAQ stocks and most OTCBB & Pink Sheet stocks. This happens because Yahoo’s data is rounded to the nearest cent. For example, there are 14000 listed instruments on the ASX. Over 8000 of them are currently trading below 20c which means they move in either 0.5 or 0.1c increments. Since Yahoo only prices in cents this introduce VERY SIGNIFICANT innacuracies. – eg. a 2.6c shown as 3c represents a 15% error).
3. Normal dividends are adjusted by subtracting all historical data by the dividend amount. Exchanges such as the ASX do not adjust price data for standard dividends. By diluting it the way they do, any technical analysis or back-testing no longer shows a correct % return, nor does it show critical technical levels such as support and resistance.
4. No sector information – critical if you want to perform sector-based analysis.
5. Significant number of missing stock splits and other capital adjustments.
Re the rounding, if the data is adjusted (for splits/rights issues etc.) then you want plenty of decimal places so your testing shows the correct % gain. In years past, the ASX had a different mechanism for determining the open and closing price of a stock, ending up with a weighted average of the bids/asks to come up with one open/close price (which would often be a fractional amount). They changed this method a few years ago to more of a volume-matching method so that it’s a “normal” trading level.
Richard Dale.
Norgate Investor Services
– Premium quality Stock, Futures and Foreign Exchange Data for
markets in Australia, Asia, Canada, Europe, UK & USA –
www.premiumdata.net
AmiBrokerYahooGroup message#68314 “Yahoo EOD data not always correct ?” http://finance.groups.yahoo.com/group/amibroker/message/68314
Q6. I am downloading EOD data from Yahoo to an ASX 200 group on a daily basis and I am also using another source. I have noticed discrepancies in quotes between these sources. It appears that Yahoo is incorrect. Sometimes it can be 5 cents or more difference.
Differences may be because one source is adjusting for dividends while the other is not. AmiQuote/Yahoo is adjusting, by default, for splits and
dividends but you can turn adjustment off by editing Formats\aqh.format file (using Notepad) and removing ADJCLOSE field.
Tomasz Janeczko – amibroker.com
Q5. For two days in a row Yahoo data for US stocks retrieved with Amiquote has been very spotty – data comes through for some symbols but not
others?
A5. This is a Yahoo problem. For example if a stock is missing the LOW price of the day AmiQuote, by default, does not import data with missing LOW-HIGH prices.
You can however turn this off – however LOW price will be still missing – in fact it will use lowest of open/close as a low).
To accept it, despite missing LOW, you can go to aqd.format file (inside Formats subdirectory) and remove $STRICT 1 line.
Tomasz Janeczko – AmiBroker.com
AmiBrokerYahooGroup message #116918 “Yahoo Data Very Spotty Last Two Days” http://finance.groups.yahoo.com/group/amibroker/message/116918
Q4. AmiQuote does not automatically list tickers for the exchanges supported by Yahoo!Finance. Are there any other Yahoo down-loaders, compatible with AmiBroker, that do?
A4. Yes, there are at least two that the author is aware of. They are both commercially available.
a) Bodhi Freeway (formerly Bodhi Gold) is a down-loader, with Yahoo capability, that allow users to select the tickers they want to download. It is distributed by JustData and is free when bundled with their data subscription packages).
http://www.justdata.com.au/Products/BodhiFreeway/bg_yahoo.htm
They produce data files in the Metastock format that can be dynamically referenced in AmiBroker using the Metastock plugin.
http://www.justdata.com.au/Training/Tutorials/Bodhi3/amibroker.htm
Sector classification is not available with Yahoo international data.
At the time of writing, Bodhi Freeway, to purchase as a stand-alone product is approximately twice the price of AmiQuote.
b) MLDownloader
http://www.trading-tools.com/
Download End-of-Day stock quotes on 50+ exchanges worldwide. Forex, commodity futures, market indices, mutual funds, money market funds, ETF, corporate bonds, and metals are also supported.
Stores data in MetaStock or in the form of ASCII files.
Supports all common MetaStock formats (Version 6.52, 8.0, 9.0 and 10.0 (6000 securities per directory)).
Stock splits are performed automatically.
Notification when dividends were distributed.
Automatic update of indices and maintenance of your symbol lists.
Download attempts can easily be repeated – Detects symbol changes.
Downloading data can be scheduled.
Automatically connecting, downloading and disconnecting for analogue modem users.
MLDownloader supports multiple stock quotes servers like Yahoo, MSN.com or Quote.com
Easy way to create symbol list from existing MetaStock database and continue updating historical EOD data.
Auto-re-download of missing data.
Option of Daily, Weekly and Monthly or Intraday data.
At the time of writing, MLD, is approximately twice the price of AmiQuote.
Q3. I am having problems with the US-Stocks database. There are 8630 symbols in the database. Yahoo has no historical data for over 300 of them. Amiquote puts ‘junk’ (html 404 error) in the data file for missing historical data.
A3. Authors comments – Not all download errors are caused by a lack of historical data. Sometimes this occurs because there have been symbol (name) changes or companies have restructured in some way (mergers, de-listings) and this is not reflected in the Yahoo database. Typically the majority of them are .OB (Bulletin Board) stock. This is not an error caused by AmiQuote, AmiBroker or the US _Stocks database.
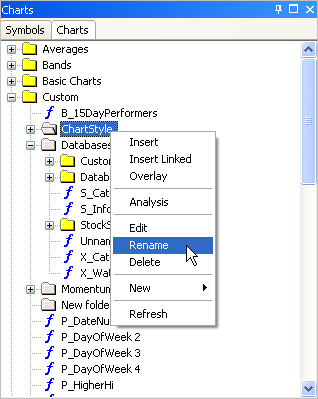
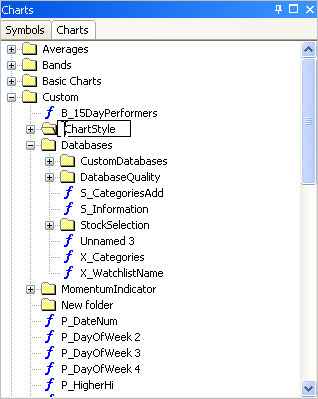
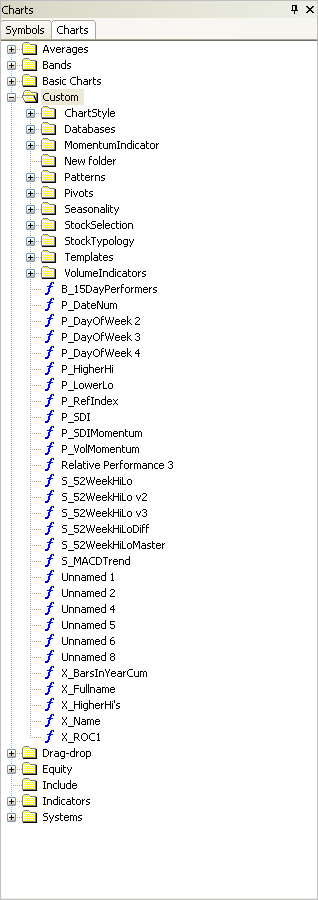
Within AmiBroker they can be reported as NoQuotes and sent to a Watch list by using the Database Purify Tool (they have been sorted into a NoQuotes watch list by the developer of the US_Stocks template). They can be deleted from the database by deleting them from the Watch list, or alternatively users can check the Yahoo site to find the reason for the ‘failure to download’ and make repairs to the database where necessary.
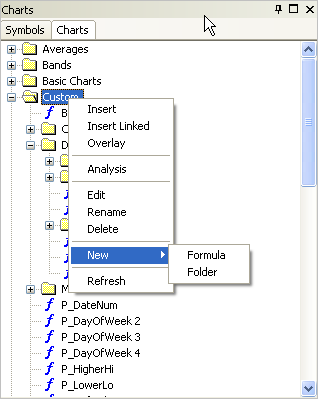
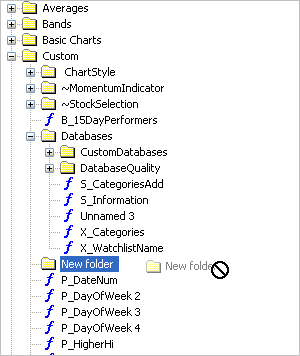
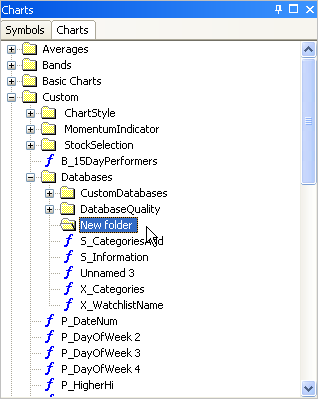
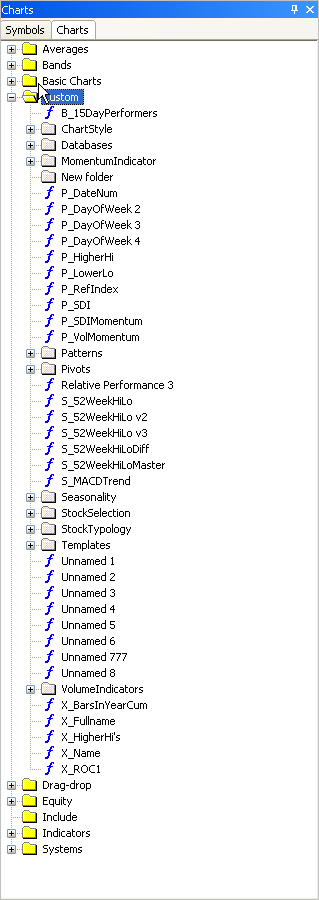
Examples of how to use the Database Purification Tool, and other a tips and tricks to help with quality control of databases, have been documented in this section of the Users’ Knowledge Base.
Q2. I recently purchased AmiBroker & downloaded historical quotes from Yahoo. The volume display will not display values greater than 2,147,483,648.00 for indexes. All the recent volume values stop at this level. Is there a way to increase the display limit for volume?
A2. 2,147,483,648 is the upper limit for integers in AmiBroker. The volume, as it is imported from Yahoo, can be adjusted down using decimal factors. Refer to the AmiBroker Knowledge Base article http://www.amibroker.com/kb/index.php?s=Yahoo by Tomasz Janeczko. Also search the Yahoo message board archives, or the Help manual, for $volfactor to find additional information.
AmiBrokerYahooGroup message #116336 “Volume Display Stops at 2,147,483,648.00 on Indexes” http://finance.groups.yahoo.com/group/amibroker/message/116336
Q1. Is there a template for downloading Yahoo data, plus sectors, for the international markets like Germany or India?
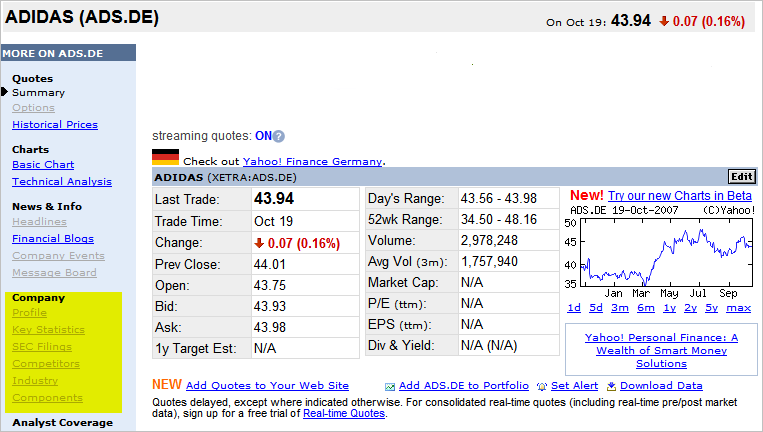
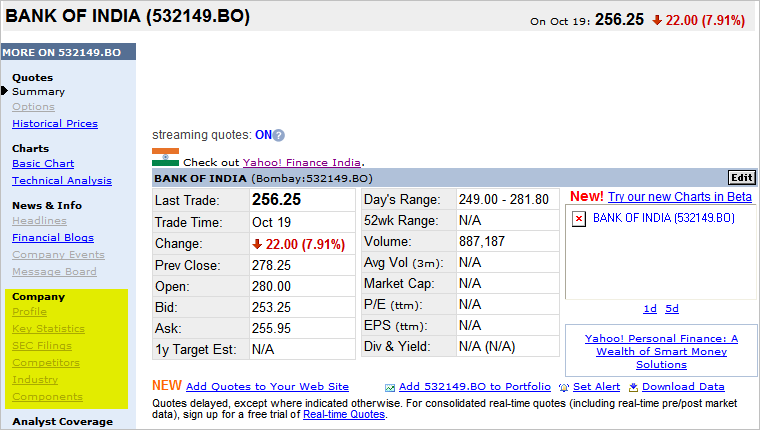
A1. Authors comments – sorry but it appears not (unless someone comes forward and tells us otherwise). Generally the products and services available for the American market are superior to the other Yahoo supported markets e.g. for the American market a database is maintained, including sector classification, for approximately 8000 stocks (the sector information can be found on the Yahoo!Finance Profile page for each stock).
By comparison, the Company information, including the Profile, is not available for the leading German or Indian stocks, let alone a range representative of those market as a whole.
Germany – the top 30 company Adidas has no active links in the Company section.
India – the top 100 company Bank of India has no active links in the Company section.
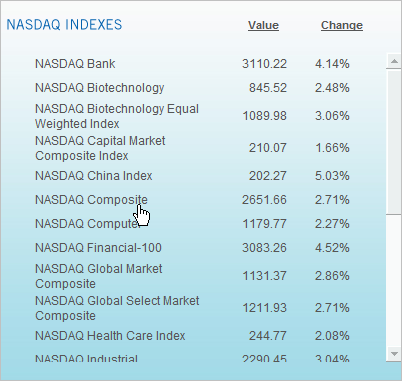
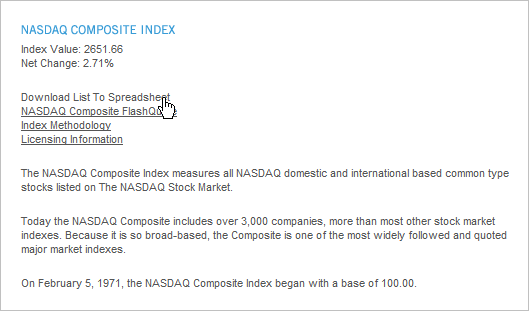
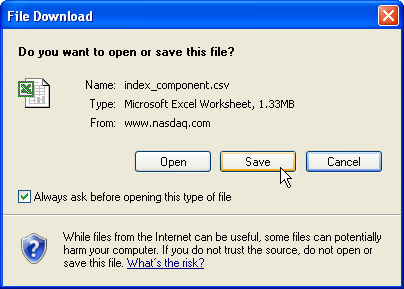
Further to that, many of the Y!Finance international sites do not provide constituent lists for ‘local’ indices.
The only way around this appears to be:
- – for people to dig in and find some local information to use,
- – use the global indices constituents for international markets,
- – ‘practice’ on the American markets then ‘purchase’ local data, for comparison and trading, later,
- – or, pay for the information.
Unfortunately the trend is towards ‘pay for play’ e.g. index lists for German stocks are downloadable from the Xetra site http://deutsche-boerse.com/dbag/dispatch/en/kir/gdb_navigation/technology/20_Applications/10_Trading/10_Xetra_Trading_Platform but only on a subscription basis.
Standard and Poors maintain global indices that cover 70-80% of the equity market for the major international regions. Constituent lists, including GIC’s classifications, are downloadable from their site but only approximately 30-40 German companies are deemed liquid enough to make that list.
http://www2.standardandpoors.com/portal/site/sp/en/us/page.home/home/1,1,1,1,0,0,0,0,0,0,0,0,0,0,0,0.html
Alternatively, “If you can’t beat them, join them”. Consider trading the American market and enjoy the benefits of participation in a liquid market (commissions might be cheaper than trading in your own country).
AmiBrokerYahooGroup message #116257 “Flags to get industry data from yahoo” http://finance.groups.yahoo.com/group/amibroker/message/116257
 Filed by brian_z at 8:54 pm under Database Management Resources