by Wayne (GP)
Introduction
From version 4.67.0, AmiBroker provides a custom backtester interface to allow customising the operation of the backtester’s second phase which processes the trading signals. This allows a range of special situations to be achieved that aren’t natively supported by the backtester. AmiBroker tends to refer to this as the Advanced Portfolio Backtester Interface, but as it seems to be more widely referred to as the Custom Backtester Interface, I will use this latter terminology.
Due to the object model used by the backtester interface, a higher level of programming knowledge is required than for simple AFL or looping. This document starts by discussing that model, so is aimed at AFL programmers who are already proficient and comfortable with basic AFL use, array indexing, and looping. If you don’t understanding looping, then you almost certainly won’t understand the custom backtester interface.
The Object Model
The modern programming paradigm is called object-oriented programming, with the system being developed modelled as a set of objects that interact. The custom backtester interface follows that model.
An object can be thought of as a self-contained black-box that has certain properties and can perform certain functions. Internally it’s a combination of code and variables, where both can be made either private to the internals of the object only or accessible from outside for the benefit of users of the object. The private code and variables are totally hidden from the outside world and are of no interest to users of the object. Only developers working on the object itself care about them. Users of the object are only interested in the code and variables made accessible for their use.
Any variable made accessible to an object’s user is called a property of the object. For example, the Backtester object has a property (variable) called “Equity”, which is the current value of the portfolio equity during a backtest. Properties can be read and written much the same as any other variable, just by using them in expressions and assigning values to them (although some properties may be read-only). However, the syntax is a little different due to the fact they’re properties of an object, not ordinary variables.
An object’s code is made accessible to its users by providing a set of functions that can be called in relation to the object. These functions are called methods of the object. They are essentially identical to ordinary functions, but perform operations that are relevant to the purpose of the object. For example, the Backtester object has methods (functions) that perform operations related to backtesting. Methods are called in much the same way as other functions, but again the syntax is a little different due to them being methods of an object rather than ordinary functions.
The aim of the object model is to view the application as a set of self-contained and reusable objects that can manage their own functionality and provide interfaces for other objects and code to use. Imagine it as being similar to a home entertainment system, where you buy a number of components (objects) like a TV, DVD player, surround-sound system, and karaoke unit (if you’re that way inclined!). Each of those components manages its own functionality and provides you with a set of connectors and cables to join them all together to create the final application: the home entertainment system. The beauty of that arrangement is that each component provides a standard interface (if you’re lucky) that will allow any brands of the other components to be connected, without those components having to know the details of how all the other components work internally, and considerable choice in the structure of the final entertainment system constructed. Similarly, software objects have standard interfaces in the form of methods and properties that allow them to be used and reused in any software.
Accessing Oject Properties And Methods
To access the properties and methods of an object, you need to know not only the name of the property or method, but also the name of the object. In AmiBroker AFL, you cannot define or create your own objects, only use objects already provided by AmiBroker. AmiBroker help details all its objects, methods, and properties in the section “Advanced portfolio backtester interface”.
To use real AFL examples, the first object detailed in the help is the Backtester object. AmiBroker provides a single Backtester object to perform backtests. To use the Backtester object, you first have to get a copy of it and assign that to your own variable:
bo = GetBacktesterObject();
The variable “bo” is your own variable, and you can call it whatever you like within the naming rules of AFL. However, to avoid a lot of verbose statements, it’s good to keep it nice and short. Previously you’ve only dealt with variables that are either single numbers, arrays of numbers, or strings. The variable “bo” is none of those, instead being a new type of variable called an object variable. In this case it holds the Backtester object (or really a reference to the Backtester object, but I don’t want to get into the complicated topic of references here). Now that you have the Backtester object in your own variable, you can access its properties and methods.
The syntax for referencing an object’s property is objectName.objectProperty, for example bo.InitialEquity,. That can then be used the same as any other variable (assuming it’s not a read-only property, which InitialEquity is not):
bo.InitialEquity = 10000;
capital = bo.InitialEquity;
gain = (capital - bo.InitialEquity) / bo.InitialEquity * 100;
From this you can see the advantage of keeping object variable names short. If you called the variable “myBacktesterObject”, then for the last example above you’d end up with:
gain = (capital - myBacktesterObject.InitialEquity) / myBacktesterObject.InitialEquity * 100;
===============
Here I’ve had to reduce the font size just to fit it all on a single line.
If a property is read-only, then you cannot perform any operation that would change its value. So, using the Equity property which is read-only:
currentEquity = bo.Equity; // This is fine
but:
bo.Equity = 50000; // This is an error!
The same syntax is used to access the methods of an object. The method name is preceded by the object name with a decimal point: objectName.objectMethod(). Any parameters are passed to the method in the same manner as to ordinary functions:
objectName.objectMethod(parm1, parm2, parm3).
For example, to call the Backtester object’s AddCustomMetric method and pass the two compulsory parameters Title and Value, a statement like this would be used:
bo.AddCustomMetric("myMetric", 1000);
AmiBroker help indicates that this method returns a value of type “bool”, which means boolean and thus can only take the values True and False. However, it doesn’t detail what this return value means. A good guess would be that it returns True if the custom metric was successfully added and False if for some reason it failed to be added. However, that’s only a guess, but a common reason for returning boolean values. For some of the other methods that return values of type “long”, it’s more difficult to guess what they might contain.
Another example with a return parameter:
sig = bo.GetFirstSignal(i);
Here the variable “sig” is another object variable, but this time of type Signal rather than Backtester. In other words, it holds a Signal object rather than a Backtester object. Unlike the single Backtester object, AmiBroker can have many different Signal objects created at the same time (one for each trading signal). As a Signal object holds the signal data for a particular symbol at a particular bar, the method needs to know the bar number, which would typically be specified using a loop index variable (‘i’ above) inside a loop:
for (i = 0; i < BarCount; i++)
{
    . . . .
    sig = bo.GetFirstSignal(i);
    . . . .
}
Once a Signal object has been obtained, its properties and methods can be referenced:
sig.PosScore = 0;    //  Set position score to zero for this bar
if (sig.IsEntry())    //  If this bar's signal is entry (buy/short)
{
    . . . .
}
Note that the property sig.PosScore is a single number, not an array. While the AFL variable PositionScore is an array, the “sig” object only holds data for a single bar, so the property sig.PosScore is the position score value for that bar only, thus a single number.
Also note that AmiBroker help is not very clear on some topics. For example, the Signal object only has a few methods that indicate whether the current bar contains an entry, exit, long, or short signal, or has a scale in or out signal. However, it doesn’t indicate how you combine these to get the exact details. For example, how do you tell the difference between a scale-in and a scale-out? Is scaling in to a long position a combination of IsScale, IsEntry, and IsLong, or perhaps just IsScale and IsLong, or neither of those? In some cases you need to use trial and error and see what actually works (learn how to use the DebugView program with _TRACE statements: see Appendix B). Fortunately for this specific example, the Signal object also has a property called Type that indicates exactly what type the signal is.
Using The Custom Backtester Interface
To use your own custom backtest procedure, you first need to tell AmiBroker that you will be doing so. There are a few ways of doing this:
- By setting a path to the file holding the procedure in the Automatic Analysis Settings Portfolio page. This procedure will then be used with all backtests, if the “Enable custom backtest procedure” checkbox is checked.
- By specifying these same two settings in your AFL code using the functions SetOption(“UseCustomBacktestProc”, True) and SetCustomBacktestProc(““). Note that path separators inside strings need to use two backslashes, for example “c:\\AmiBroker\\Formulas\\Custom\\Backtests\\MyProc.afl”. Although why is not important here, it’s because a single backslash is what’s called an escape character, meaning the character(s) after it can have special meaning rather than just being printable characters, so to actually have a printable backslash, you have to put two in a row.
- By putting the procedure in the same file as the other AFL code and using the statement SetCustomBacktestProc(“”). This tells AmiBroker that there is a custom backtest procedure but there’s no path for it, because it’s in the current file. This option will be used throughout the rest of this document.
The next thing that’s required in all backtest procedures is to ensure the procedure only runs during the second phase of the backtest. That’s achieved with the following conditional statement:
if (Status("action") == actionPortfolio)
{
    . . . .
}
And finally, before anything else can be done, a copy of the Backtester object is needed:
bo = GetBacktesterObject();
So all custom backtest procedures, where they’re in the same file as the other AFL code, will have a template like this:
SetCustomBacktestProc("");
if (Status("action") == actionPortfolio)
{
    bo = GetBacktesterObject();

    //  Rest of procedure goes here

}
If the backtests were using a procedure in the file:
c:\AmiBroker\Formulas\Custom\Backtests\MyBacktest.afl
then the first line above in your system AFL code would be replaced with:
SetOption("UseCustomBacktestProc", True);
SetCustomBacktestProc("c:\\AmiBroker\\Formulas\\Custom\\Backtests\\MyBacktest.afl");
and the rest of the procedure would be in the specified file. Or, if the same values were specified in the Automatic Analysis settings, the two lines above would not be needed in your AFL code at all, and the procedure would be in the specified file.
Custom Backtester Levels
The AmiBroker custom backtester interface provides three levels of user customisation, simply called high-level, mid-level, and low-level. The high-level approach requires the least programming knowledge, and the low-level approach the most. These levels are just a convenient way of grouping together methods that can and need to be called for a customisation to work, and conversely indicate which methods cannot be called in the same customisation because their functionality conflicts. Some methods can be called at all levels, others only at higher levels, and others only at lower levels. AmiBroker help details which levels each method can be used with. Naturally, the higher the level and the simpler the programming, the less flexibility that’s available.
This document will not detail every single method and property available, so the rest of this document should be read in conjunction with the AmiBroker help sections “Advanced portfolio backtester interface” and “Adding custom backtest metrics”.
High-Level Interface
The high-level interface doesn’t allow any customising of the backtest procedure itself. It simply allows custom metrics to be defined for the backtester results display, and trade statistics and metrics to be calculated and examined. A single method call runs the whole backtest in one hit, the same as when the custom backtester interface isn’t used at all.
AmiBroker help has an example of using the high level interface to add a custom metric. See the section called “Adding custom backtest metrics”. In essence, the steps are:
- Start with the custom backtest template above
- Run the backtest
- Get the performance statistics or trade details
- Calculate your new metric
- Add your new metric to the results display
That would look something like this:
SetCustomBacktestProc("");
if (Status("action") == actionPortfolio)
{
    bo = GetBacktesterObject();    //  Get backtester object
    bo.Backtest();    //  Run backtests
    stats = bo.GetPerformanceStats(0);    //  Get Stats object for all trades
    myMetric = <calculation using stats>;    //  Calculate new metric
    bo.AddCustomMetric("MyMetric", myMetric);    //  Add metric to display
}
As well as just using the built-in statistics and metrics, obtained from the Stats object after the backtest has been run, it’s also possible to calculate your metric by examining all the trades using the Trade object. As some positions may still be open at the end of the backtest, you may need to iterate through both the closed trade and open position lists:
for (trade = bo.GetFirstTrade(); trade; trade = bo.GetNextTrade())
{
    . . . .
}
for (trade = bo.GetFirstOpenPos(); trade; trade = bo.GetNextOpenPos())
{
    . . . .
}
In this example, “trade” is an object variable of type Trade, meaning it holds a Trade object. As with the Signal object, AmiBroker can have many Trade objects created at the same time, one for each closed or open trade. The first for loop iterates through the closed trade list, and the second through the open position trade list. The continuation condition “trade” theoretically means while the trade object is not zero, but in fact “trade” will be Null when the end of the list is reached. However, any conditional involving a null value is always false, so this will still work. The five Backtester object methods GetFirstTrade, GetNextTrade, GetFirstOpenPos, GetNextOpenPos, and FindOpenPos all return Null when the end of the list is reached or if no trade or open position is found.
The for loops are a little different to normal for loops in that they don’t have a standard loop index variable like ‘i’ that gets incremented at the end of each pass. Instead they call a Backtester object method to get the initial value (the first Trade object) and then another member to get the next value (the next Trade object). So the for loop conditions here are just saying start from the first Trade object, at the end of each pass get the next Trade object, and keep doing that until there are no more Trade objects (ie. “trade” is Null). The loops are iterating through the list of trades, not the bars on a chart. Each Trade object holds the details for a single trade.
Putting that code inside the custom backtest template looks like this:
SetCustomBacktestProc("");
if (Status("action") == actionPortfolio)
{
    bo = GetBacktesterObject();    //  Get backtester object
    bo.Backtest();    //  Run backtests
    for (trade = bo.GetFirstTrade(); trade; trade = bo.GetNextTrade())
    {
        . . . .    //  Use Trade object here
    }
    for (trade = bo.GetFirstOpenPos(); trade; trade = bo.GetNextOpenPos())
    {
        . . . .    //  Use Trade object here
    }
    myMetric = <some result from Trade object calculations>;
    bo.AddCustomMetric("MyMetric", myMetric);    //  Add metric to display
}
As an example, say we want to calculate the average number of calendar days that winning trades were held for (there’s already a built-in Stats object value for number of bars, but we want number of calendar days). For that we’ll need a function that can calculate the number of calendar days between two dates. Let’s call it “DayCount”, a function that takes two parameters: the entry date and the exit date, both in AmiBroker date/time format. Since this document is about the custom backtester interface, I don’t want to go into how that function works right now. Let’s just assume it does, but the code for such a function is given in Appendix A if you’re interested. Then, for each trade we’ll need to know:
- If it was a winning or losing trade
- The entry date
- The exit date
And to calculate the average, we’ll need a total figure for the number of winning trade days and another total figure for the number of trades. The average is the total number of days winning trades were held divided by the total number of winning trades.
For the trade details, the Trade object has the following properties:
- EntryDateTime The entry date & time
- ExitDateTime The exit date & time
and the following method:
- GetProfit() The profit for the trade
Before trying this example, the first time we’ve used this Trade object method, we make the assumption that the profit will be negative for losing trades and positive for winning trades, as AmiBroker help doesn’t clarify that detail (it could be some undefined value for losing trades). If trial and error proves that not to be the case, then we could alternatively try using the Trade object properties EntryPrice, ExitPrice, and IsLong to determine if it was a winning or losing trade. As it turns out upon testing, GetProfit does in fact work as expected.
Note that the Trade object also has a property called BarsInTrade, which looks like it could potentially be used instead of the dates, but that only gives the number of bars, not the number of calendar days.
So, to get the number of calendar days spent in a trade, we call our DayCount function passing the entry and exit dates:
DayCount(trade.EntryDateTime, trade.ExitDateTime);
and to determine if it was a winning trade, where break-even doesn’t count as winning:
trade.GetProfit() > 0;
The whole procedure would then be:
SetCustomBacktestProc("");
if (Status("action") == actionPortfolio)
{
    bo = GetBacktesterObject();    //  Get backtester object
    bo.Backtest();    //  Run backtests
    totalDays = 0;    //  Total number of winning days
    totalTrades = 0;    //  Total number of winning trades
    for (trade = bo.GetFirstTrade(); trade; trade = bo.GetNextTrade())
    {    //  Loop through all closed trades
        if (trade.GetProfit() > 0)    //  If this was a winning trade
        {
            totalDays = totalDays + DayCount(trade.EntryDateTime, trade.ExitDateTime);
            totalTrades++;
        }
    }    //  End of for loop over all trades
    avgWinDays = totalDays / totalTrades;    //  Calculate average win days
    bo.AddCustomMetric("AvgWinDays", avgWinDays);    //  Add to results display
}
Note that we only need to consider closed trades in this example, as counting open positions would not accurately reflect the number of days trades were typically held for. Also, the “totalTrades” variable only counts winning trades, not all trades, since we’re only averaging over winning trades.
When a backtest is run with this custom interface and a report generated, our new metric “avgWinDays” will be printed at the bottom of the report:
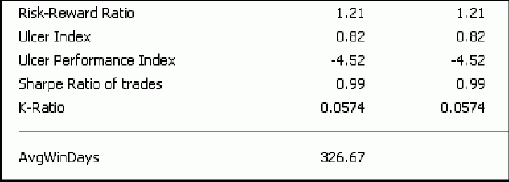
And if we run an optimisation (using a different backtest to above), it will have a column near the right-hand end of the results:

Note that the reason the “W. Avg Bars Held” column doesn’t seem to agree with the “AvgWinDays” column (ie. the former goes down while the latter goes up) is because the average bars figure includes open positions at the end of the backtest whereas we specifically excluded them.
As well as overall metrics per backtest, it’s also possible to include individual trade metrics in the backtester results. For this, the metric is added to each Trade object rather than the Backtester object and the trades are listed at the end of the procedure.
For example, to display the entry position score value against each trade in the backtester results, the following code could be used:
SetCustomBacktestProc("");
if (Status("action") == actionPortfolio)
{
    bo = GetBacktesterObject();    //  Get backtester object
    bo.Backtest(True);            //  Run backtests with no trade listing
    for (trade = bo.GetFirstTrade(); trade; trade = bo.GetNextTrade())
        trade.AddCustomMetric("Score", trade.Score);    //  Add closed trade score
    for (trade = bo.GetFirstOpenPos(); trade; trade = bo.GetNextOpenPos())
        trade.AddCustomMetric("Score", trade.Score);    //  Add open pos score
    bo.ListTrades();            //  Generate trades list
}
The first for loop iterates through the closed trade list and the second through the open position list to get the entry score value for every trade listed in the results. Note that the bo.BackTest call is passed the value “True” in this case to prevent the list of trades being generated automatically by the backtester. Instead, they’re generated by the subsequent call to the bo.ListTrades method.
As another example, say we want to list for each winning trade how far above or below the average winning profit it was as a percentage, and similarly for each losing trade, how far above or below the average loss it was as a percentage. For this we need the “WinnersAvgProfit” and “LosersAvgLoss” values from the Stats object, and the profit from the Trade objects for each closed trade (for this example we’ll ignore open positions). Relative loss percentages are displayed as negative numbers.
SetCustomBacktestProc("");
if (Status("action") == actionPortfolio)
{
    bo = GetBacktesterObject();    //  Get backtester object
    bo.Backtest(True);            //  Run backtests with no trade listing
    stat = bo.GetPerformanceStats(0);    //  Get Stats object for all trades
    winAvgProfit = stat.GetValue("WinnersAvgProfit");
    loseAvgLoss = stat.GetValue("LosersAvgLoss");
    for (trade = bo.GetFirstTrade(); trade; trade = bo.GetNextTrade())
    {                    //  Loop through all closed trades
        prof = trade.GetProfit();        //  Get trade profit in dollars
        relProf = 0;            //  This will be profit/avgProfit as %
        if (prof > 0)            //  If a winner (profit > 0)
            relProf = prof / winAvgProfit * 100;    //  Profit relative to average
        else                //  Else if a loser (profit <= 0)
            relProf = -prof / loseAvgLoss * 100;    //  Loss relative to average
        trade.AddCustomMetric("Rel Avg Profit%", relProf);    //  Add metric
    }                    //  End of for loop over all trades
    bo.ListTrades();            //  Generate list of trades
}
Mid-Level Interface
To be able to modify actual backtest behaviour, the mid-level or low-level interfaces must be used. New metrics can also be calculated at these levels, but since that’s already covered above, this section will only look at what backtest behaviour can be modified at this level. Essentially this means using Signal objects as well as the Backtester object.
With the mid-level interface, each trading signal at each bar can be examined and the properties of the signals changed, based on the value of other Signal or Backtester object properties, before any trades are executed for that bar. For example, one Backtester object property is “Equity”, which gives the current portfolio equity, and one Signal object property is “PosSize”, the position size specified in the main AFL code, so the mid-level interface can allow, for example, position size to be modified based on current portfolio equity.
The custom backtester interface template for a mid-level approach, where all the signals at each bar need to be examined, is:
SetCustomBacktestProc("");
if (Status("action") == actionPortfolio) {
    bo = GetBacktesterObject();    //  Get backtester object
    bo.PreProcess();    //  Do pre-processing (always required)
    for (i = 0; i < BarCount; i++)    //  Loop through all bars
    {
        for (sig = bo.GetFirstSignal(i); sig; sig = bo.GetNextSignal(i))
        {    //  Loop through all signals at this bar
                . . . .
        }    //  End of for loop over signals at this bar
        bo.ProcessTradeSignals(i);    //  Process trades at bar (always required)
    }    //  End of for loop over bars
    bo.PostProcess();    //  Do post-processing (always required)
}
In this example, the variable “sig” is an object variable of type Signal, meaning it holds a Signal object. As with the Trade object in the earlier example, the inner for loop iterates through the list of signals at each bar, not through all bars on a chart. The for loop conditions are effectively saying start from the first Signal object for the current bar, at the end of each pass get the next Signal object for the same bar, and keep doing that until there are no more Signal objects for the bar (ie. “sig” is Null). Each Signal object holds the details of one signal at the current bar (ie. a buy, sell, short, cover or scale indication for one symbol).
The main differences between the mid-level and high-level approaches are:
- The Backtester object’s Backtest method is not called.
- The Backtester object’s ProcessTradeSignals method is called instead at each bar, after examining and possibly modifying some of the Signal object properties and/or closed or open Trade object properties.
- A loop is required to iterate through all bars of the chart.
- A nested loop is required inside that one to iterate through all the signals at each of those bars.
If a trading decision needs to be based on some other property of a particular stock, like it’s average daily trading volume for example, then the stock code symbol must be used to obtain that information. This is available in the Signal object’s “Symbol” property. However, since the backtester at this level is not run in the context of a particular symbol, the data must be saved to a composite symbol in the main code (or perhaps a static variable) and referenced in the custom backtest procedure with the Foreign function. For example, in the main AFL code:
AddToComposite(EMA(Volume, 100), "~evol_"+Name(), "V", atcFlagDefaults | atcFlagEnableInBacktest);
Here the volume EMA array is saved to a separate composite symbol for each stock (ie. each composite consists of just a single stock). For this to work in backtests, the atcFlagEnableInBacktest flag must be used. Then in the custom backtest procedure:
evol = Foreign("~evol_"+sig.Symbol, "V");  //  Get symbol's volume array
evi = evol[i];    //  Reference a value in the array
As a real example, to limit the number of shares purchased to a maximum of 10% of the 100 day EMA of the daily volume, and also ensure the position size is no less than $5,000 and no more than $50,000, the following mid-level procedure could be used:
SetCustomBacktestProc("");
if (Status("action") == actionPortfolio)
{
    bo = GetBacktesterObject();    //  Get backtester object
    bo.PreProcess();    //  Do pre-processing
    for (i = 0; i < BarCount; i++)    //  Loop through all bars
    {
        for (sig = bo.GetFirstSignal(i); sig; sig = bo.GetNextSignal(i))
        {    //  Loop through all signals at this bar
            if (sig.IsEntry() && sig.IsLong())    //  If this signal is a long entry (ie. buy)
            {
                evol = Foreign("~evol_"+sig.Symbol, "V");   //  Get stock's composite volume array
                psize = sig.PosSize;    //  Get position size specified in AFL code
                if (psize < 0)    //  If it's negative (a percentage of equity)
                    psize = (-psize/100) * bo.Equity;  //  Convert to dollar value using current equity
                scnt = psize / sig.Price;    //  Calculate number of shares for position size
                if (scnt > evol[i] / 10)    //  If number of shares is > 10% of volume EMA
                {
                    scnt = evol[i] / 10;    //  Limit number of shares to 10% of EMA value
                    psize = scnt * sig.Price;    //  Calculate new position size
                }
                if (psize < 5000)    //  If position size is less than $5,000
                    psize = 0;    //  Set to zero so buy signal will be ignored
                else
               {
                    if (psize > 50000)    //  If position size is greater than $50,000
                        psize = 50000;    //  Limit to $50,000
                }
                sig.PosSize = psize;    //  Set modified position size back into object
            }
        }    //  End of for loop over signals at this bar
        bo.ProcessTradeSignals(i);    //  Process trades at this bar
    }    //  End of for loop over bars
    bo.PostProcess();    //  Do post-processing
}
In this example, the statement psize = (-psize/100) * bo.Equity converts the percentage of equity value (which is negative) to its actual dollar value, using the Backtester object’s Equity property. The term -psize/100 (which doesn’t actually need to be inside brackets) converts the negative percentage to a positive fraction which is then multiplied by the current portfolio equity.
The statement if (sig.IsEntry() && sig.IsLong()) calls the two Signal object methods IsEntry and IsLong to determine if the current signal is an entry signal and a long signal (ie. a buy signal). Remember that the && operator is equivalent to AND. An alternative would be to check if the Signal object’s Type property was equal to one.
The array variable “evol” contains the whole EMA array realigned to the number of bars used by the custom backtest procedure. Padded bars don’t matter here as there won’t be any signals for the stock at any of those bars, and we’re only checking the volume on bars where there is a signal. As “evol” is an array, at each bar we’re only interested in the value for the current bar, hence the references to evol[i].
Finally, as detailed in the AmiBroker help, the Signal object’s Price property gives the price for the current signal, so there’s no need to use BuyPrice, SellPrice, etc., and the PosSize property is the signal’s position size value for the current bar. As this is not a read-only property, it can be both read and modified.
Another example, to prevent scaling in a position that already has $50,000 or more in open position value:
SetCustomBacktestProc("");
if (Status("action") == actionPortfolio)
{
    bo = GetBacktesterObject();    //  Get backtester object
    bo.PreProcess();    //  Do pre-processing
    for (i = 0; i < BarCount; i++)    //  Loop through all bars
    {
        for (sig = bo.GetFirstSignal(i); sig; sig = bo.GetNextSignal(i))
        {    //  Loop through all signals at this bar
            if (sig.Type == 5)    //  If signal type is scale-in
            {
                trade = bo.FindOpenPos(sig.Symbol);   //  Check for open position in stock
                if (trade)    //  Or could use "if (!IsNull(trade))"
                {
                    if (trade.GetPositionValue() >= 50000)  //  If open position value >= $50,000
                        sig.PosSize = 0;    //  Set position size to zero to prevent purchase
                }
            }
        }    //  End of for loop over signals at this bar
        bo.ProcessTradeSignals(i);    //  Process trades at this bar
    }    //  End of for loop over bars
    bo.PostProcess();    //  Do post-processing
}
In this example, as each new scale-in signal is detected, the list of open positions is checked for an open position in the same stock as the new signal. If an open position exists, its current value is obtained, and if that value is $50,000 or more, the position size is set to zero to prevent the scale-in from happening.
The example combines use of the Backtester object, Signal objects and Trade objects to determine whether or not scale-in of a position should be permitted. Note that the Trade object is returned Null if no open position is found. As any comparison with a null value is always false, provided the test is for the True condition then the IsNull function is not needed: ie. “if (trade)” gives the same result as “if (!IsNull(trade))”. However, if the test is for the negative condition, IsNull is required: ie. “if (!trade)” won’t work (when “trade” is Null it will be treated as False rather than the desired True) and “if (IsNull(trade))” becomes necessary.
Low-Level Interface
The low-level interface provides the most flexibility to control backtester operation. As well as allowing signal properties to be modified, it also allows the entering, exiting, and scaling of trades even if no signal exists.
With the low-level interface, each trading signal at each bar can be examined, the properties of the signals changed, and trades entered, exited, and scaled. This could be used to implement special stop conditions not provided in the ApplyStop function, or to scale trades based on current portfolio equity or open position value and the like.
The custom backtester interface template for a low-level approach is:
SetCustomBacktestProc("");
if (Status("action") == actionPortfolio)
{
    bo = GetBacktesterObject();    //  Get backtester object
    bo.PreProcess();    //  Do pre-processing
    for (i = 0; i < BarCount; i++)    //  Loop through all bars
    {
        for (sig = bo.GetFirstSignal(i); sig; sig = bo.GetNextSignal(i))
        {    //  Loop through all signals at this bar
            . . . .
        }    //  End of for loop over signals at this bar
        bo.HandleStops(i);    //  Handle programmed stops at this bar
        bo.UpdateStats(i, 1);    //  Update MAE/MFE stats for bar
        bo.UpdateStats(i, 2);    //  Update stats at bar's end
    }    //  End of for loop over bars
    bo.PostProcess();    //  Do post-processing
}
Note that this template currently has no trades performed in it, as there are a number of options there depending on the system. Typically, inside the signal loop (or possibly the trades loop) there will be a number of tests for various conditions and then trades entered, exited, and scaled accordingly.
The main differences between the low-level and mid-level approaches are:
- The Backtester object’s ProcessTradeSignals method is not called.
- The Backtester object’s EnterTrade, ExitTrade, and ScaleTrade methods are called instead at each bar, after examining and possibly modifying some of the signal properties and/or closed or open trade properties.
- The Backtester object’s HandleStops method must be called once per bar to apply any stops programmed in the settings or by the ApplyStop function.
- The Backtester object’s UpdateStats method must be called at least once for each bar to update values like equity, exposure, MAE/MFE, etc. The AmiBroker help is a little vague on how the TimeInsideBar parameter works (the values ‘1’ & ‘2’ in the sample above), but it must be called exactly once with that parameter set to two. It should also be called with it set to one to update the MAE/MFE statistics, but why it would be called with the value set to zero or more than once, I’m not sure.
As an example, let’s create a custom backtest procedure that scales in a long position by 50% of its injected capital (ie. excluding profit) whenever its open position profit exceeds its total injected capital, which means it’s sitting on 100% or more profit. The scale-in can be repeated whenever this condition occurs, as immediately after each scale-in, the injected capital will go up by 50%. The system doesn’t do any shorting and no other scaling occurs.
The required conditions therefore are:
- The profit must be greater than the injected capital to scale in.
- The scale-in position size is equal to half the injected capital.
- No signal is required to perform the scale-in.
The Signal object list is still needed to enter and exit all trades, as there’s no other mechanism to do that, but just the Trade object list is needed for scaling open positions. At each bar, each open long position in the trade open position list must be tested for scaling in, and a scale-in performed if the conditions are met.
The test for scale-in then looks like this:
trade.GetProfit() >= trade.GetEntryValue(); // Entry value is injected capital
The scale-in position size is:
scaleSize = trade.GetEntryValue() / 2; // Half of total injected capital
And the scale-in method call, using the closing price for scaling, is:
bo.ScaleTrade(i, trade.Symbol, True, trade.GetPrice(i, "C"), scaleSize);
Putting it all into our template gives:
SetCustomBacktestProc("");
if (Status("action") == actionPortfolio)
{
    bo = GetBacktesterObject();    //  Get backtester object
    bo.PreProcess();    //  Do pre-processing
    for (i = 0; i < BarCount; i++)    //  Loop through all bars
    {
        for (sig = bo.GetFirstSignal(i); sig; sig = bo.GetNextSignal(i))
        {    //  Loop through all signals at this bar
            if (sig.IsEntry() && sig.IsLong())    //  Process long entries
                bo.EnterTrade(i, sig.Symbol, True, sig.Price, sig.PosSize);
            else
            {
                if (sig.IsExit() && sig.IsLong())    //  Process long exits
                    bo.ExitTrade(i, sig.Symbol, sig.Price);
            }
        }    //  End of for loop over signals at this bar
        bo.HandleStops(i);    //  Handle programmed stops at this bar
        for (trade = bo.GetFirstOpenPos(); trade; trade = bo.GetNextOpenPos())
        {    //  Loop through all open positions
            if (trade.GetProfit() >= trade.GetEntryValue())  //  If time to scale-in
            {
                scaleSize = trade.GetEntryValue() / 2;    //  Scale-in the trade
                bo.ScaleTrade(i, trade.Symbol, True, trade.GetPrice(i, "C"), scaleSize);
            }
        }    //  End of for loop over trades at this bar
        bo.UpdateStats(i, 1);    //  Update MAE/MFE stats for bar
        bo.UpdateStats(i, 2);    //  Update stats at bar's end
    }    //  End of for loop over bars
    bo.PostProcess();    //  Do post-processing
}
Since we stated that the system doesn’t do any shorting, the tests for sig.IsLong aren’t really necessary.
The signal for loop processes all entry and exit signals generated by our buy and sell conditions in the main AFL code. As mentioned above, this is necessary since we’re not calling the ProcessTradeSignals method now, as that’s a mid-level method. The trade open position for loop checks for and processes all scaling in. When an exit signal occurs, the whole position is closed.
Extending this example now to include our custom avgWinDays metric from the high-level interface example:
SetCustomBacktestProc("");
if (Status("action") == actionPortfolio)
{
    bo = GetBacktesterObject();    //  Get backtester object
    bo.PreProcess();    //  Do pre-processing
    for (i = 0; i < BarCount; i++)    //  Loop through all bars
    {
        for (sig = bo.GetFirstSignal(i); sig; sig = bo.GetNextSignal(i))
        {    //  Loop through all signals at this bar
            if (sig.IsEntry() && sig.IsLong())    //  Process long entries
                bo.EnterTrade(i, sig.Symbol, True, sig.Price, sig.PosSize);
            else
            {
                if (sig.IsExit() && sig.IsLong())    //  Process long exits
                    bo.ExitTrade(i, sig.Symbol, sig.Price);
            }
        }    //  End of for loop over signals at this bar
        bo.HandleStops(i);    //  Handle programmed stops at this bar
        for (trade = bo.GetFirstOpenPos(); trade; trade = bo.GetNextOpenPos())
        {    //  Loop through all open positions
            if (trade.GetProfit() >= trade.GetEntryValue())  //  If time to scale-in
            {
                scaleSize = trade.GetEntryValue() / 2;    //  Scale-in the trade
                bo.ScaleTrade(i, trade.Symbol, True, trade.GetPrice(i, "C"), scaleSize);
            }
        }    //  End of for loop over trades at this bar
        bo.UpdateStats(i, 1);    //  Update MAE/MFE stats for bar
        bo.UpdateStats(i, 2);    //  Update stats at bar's end
    }    //  End of for loop over bars
    totalDays = 0;    //  Total number of winning days
    totalTrades = 0;    //  Total number of winning trades
    for (trade = bo.GetFirstTrade(); trade; trade = bo.GetNextTrade())
    {    //  Loop through all closed trades (only)
        if (trade.GetProfit() > 0)    //  If this was a winning trade
        {
            totalDays = totalDays + DayCount(trade.EntryDateTime, trade.ExitDateTime);
            totalTrades++;
        }
    }    //  End of for loop over all trades
    avgWinDays = totalDays / totalTrades;    //  Calculate average win days
    bo.AddCustomMetric("AvgWinDays", avgWinDays);    //  Add to results display
    bo.PostProcess();    //  Do post-processing
}
Note that stops are handled before scale-in checking occurs, as there’s no point scaling in a trade if it’s about to get stopped out on the same bar (although it would be unlikely to satisfy the scale-in condition anyway if it was about to get stopped out).
Also note that the Trade object method GetEntryValue returns the total amount of injected capital, including all previous scale-in amounts. It’s not possible to get just the amount used in the initial purchase. It would actually be nice here if the Trade object had a few user-defined properties, to allow the user to persist any values they wanted to throughout the life of a trade (although this could also be done with static variables). For example, as mentioned above, the initial purchase amount before any scaling could be remembered, or perhaps the number of times scaling has occurred (your system may want to limit scaling in to a maximum of say three times).
Another similar example, but this time scaling out a position once it has doubled in value, removing the initial capital invested (approximately):
SetCustomBacktestProc("");
if (Status("action") == actionPortfolio)
{
    bo = GetBacktesterObject();    //  Get backtester object
    bo.PreProcess();    //  Do pre-processing
    for (i = 0; i < BarCount; i++)    //  Loop through all bars
    {
        for (sig = bo.GetFirstSignal(i); sig; sig = bo.GetNextSignal(i))
        {    //  Loop through all signals at this bar
            if (sig.IsEntry() && sig.IsLong())    //  Process long entries
            {
                bo.EnterTrade(i, sig.Symbol, True, sig.Price, sig.PosSize);
                trade = bo.FindOpenPos(sig.Symbol);    //  Find the trade we just entered
                if (trade)    //  Or "if (!IsNull(trade))"
                    trade.MarginLoan = 0;    //  On initial buy, zero margin loan property
            }
            else
            {
                if (sig.IsExit() && sig.IsLong())    //  Process long exits
                    bo.ExitTrade(i, sig.Symbol, sig.Price);
            }
        }    //  End of for loop over signals at this bar
        bo.HandleStops(i);    //  Handle programmed stops at this bar
        for (trade = bo.GetFirstOpenPos(); trade; trade = bo.GetNextOpenPos())
        {    //  Loop through all open positions
            ev = trade.GetEntryValue();    //  Entry value of trade (ie. initial capital)
            if (!trade.MarginLoan && trade.GetProfit() >= ev)   //  Only if MarginLoan is zero
            {
                trade.MarginLoan = 1;    //  Indicate have scaled out once now
                bo.ScaleTrade(i, trade.Symbol, False, trade.GetPrice(i, "C"), ev);    //  Scale out
            }
        }    //  End of for loop over trades at this bar
        bo.UpdateStats(i, 1);    //  Update MAE/MFE stats for bar
        bo.UpdateStats(i, 2);    //  Update stats at bar's end
    }    //  End of for loop over bars
    bo.PostProcess();    //  Do post-processing
}
In this example we only want to do the scale-out once, which introduces a new problem: how do we tell whether we’ve already done it or not? Trial and error shows that the entry value returned by the GetEntryValue method halves if you remove half of the value, so AmiBroker appears to treat a scale-out of half the value as being half profit and half original capital. As mentioned above, we really need a Trade object property here that we can write to with our own information. Since we’re not using margin, we can use the MarginLoan property, which fortunately is not read-only. I tried to use the Score property first, but that turned out to be read-only, despite AmiBroker help not mentioning that fact.
This example is mostly the same as the previous one, but instead of scaling in, we now scale out. Again, the trigger condition is the profit being greater than the entry value (injected capital), but we need to use a state variable to remember whether or not we’ve already scaled out the position so that we only do it once. As mentioned above, we can’t tell this from the entry value alone. While the MarginLoan property was available and writeable in this case, it would be much better, as already mentioned, if Trade objects had some user-definable properties.
And once again as a reminder, since I use C and C++ syntax rather than the syntax defined in AmiBroker help, !trade.MarginLoan is the same as NOT trade.MarginLoan and && is equivalent to AND. The statement !trade.MarginLoan just means if trade.MarginLoan equals zero.
Conclusion
That pretty much covers the use of the custom backtester interface at all three levels. While there are a number of object properties and methods I haven’t mentioned or used, this document is not intended to be a reference manual but rather an introduction to using the interface. There should be enough information here to allow you to figure out the rest for yourself with a bit of trial and error (as I’ve had to use myself while writing this document).
Computer programming in any language can be a rewarding, but at times extremely frustrating, experience. After many hours of trying to get your “simple” piece of code working properly, by which time you’re ready to swear on your grandmother’s grave that there has to be a problem with the language interpreter or compiler, almost invariably the problem is in your own code. It could be as simple as a missing semicolon, or as complex as a complete misunderstanding about how something is supposed to work. But as Eric Idle once said, always look on the bright side of life. The good thing about an extremely frustrating problem is that it feels SO good once you finally figure it out!
Appendix A – DayCount Function
The code for the DayCount function used to calculate the number of calendar days between two date/time values is below. This includes both entry and exit days in the count. It consists of two functions, the DayCount function itself, and a DayInYear function to calculate the current day number in a year for a particular date.
Firstly, the DayInYear function:
function DayInYear(yday, ymonth, yyear)
{
    doy = yday;    //  Set number of days to current day
    for (i = 1; i < ymonth; i++)    //  Loop over all months before this one
    {
        switch (i)    //  Sum number of days in each month
        {
            case 1:
            case 3:
            case 5:
            case 7:
            case 8:
            case 10:
            case 12:
                doy = doy + 31; break;    //  Months with 31 days
            case 4:
            case 6:
            case 9:
            case 11:
                doy = doy + 30; break;    //  Months with 30 days
            case 2:
            {
                doy = doy + 28;    //  February non-leap year
                if (!(yyear % 4) && yyear != 2000)
                    doy++;    //  February leap year
                break;
            }
        }
    }
    return doy;    //  Return day in year, starting from 1
}
This gets called by the DayCount function for both the entry and exit days.
Now the DayCount function:
function DayCount(inDay, outDay)
{
    in = DateTimeConvert(0, inDay);    //  Convert entry to DateNum format
    out = DateTimeConvert(0, outDay);    //  Convert exit date

    iyy = int(in / 10000) + 1900;    //  Get entry year
    imm = int((in % 10000) / 100);    //  Month
    idd = in % 100;    //  Day
    doyi = DayInYear(idd, imm, iyy);    //  Calculate entry day in year

    oyy = int(out / 10000) + 1900;    //  Get exit year
    omm = int((out % 10000) / 100);    //  Month
    odd = out % 100;    //  Day
    doyo = DayInYear(odd, omm, oyy);    //  Calculate exit day in year

    days = 0;    //  Initialise days between to zero
    for (i = iyy; i < oyy; i++)    //  Loop from entry year to < exit year
    {
        if (!(i % 4) && i != 2000)    //  If is a leap year
            days = days + 366;    //  Has 366 days
        else
            days = days + 365;    //  Else has 365 days
    }
    days = days + doyo - doyi + 1;    //  Days/year plus exit minus entry day
    //  Plus one to include both dates
    return days;    //  Return total days between dates
}
Appendix B – Using DebugView
This appendix discusses the use of the Microsoft SysInternals program DebugView for debugging AFL applications. DebugView can be obtained from the Microsoft website here:
http://www.microsoft.com/technet/sysinternals/Miscellaneous/DebugView.mspx
When you run the program, you will get a window like this:
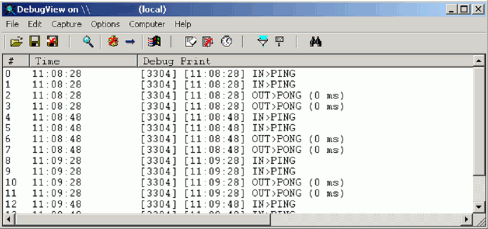
The display area is where your AFL application can write to using _TRACE statements. Note though, as can be seen above, that your application may not be the only thing sending data to the viewer. DebugView captures all data sent to the viewer from all running applications.
The main toolbar controls are:
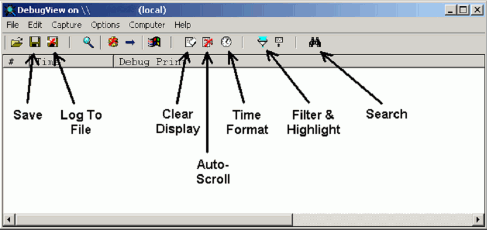
The Clear Display button is the one you’ll likely use the most while debugging an application. And as with most applications, you can multi-select lines in the output display and use Edit->Copy (Ctrl+C) to copy them to the Clipboard for pasting into another application for further analysis.
Using The AFL _TRACE Statement
To output messages to the viewer from your AFL code, including from custom backtest procedures, you use the _TRACE statement:
_TRACE("Entered 'j' for loop");
You can concatenate strings simply by “adding” them together:
_TRACE("Processing symbol " + trade.Symbol);
To include the value of parameters in the message, use the StrFormat function the same as for Plot statements:
_TRACE(StrFormat("Buying " + sig.Symbol + ", price = %1.3f", sig.Price));
A sample trace while testing the first low-level example given in this document:
That output was produced by the following code in the custom backtest procedure:
isAqp = trade.Symbol == "AQP";
if (isAqp)
    _TRACE(StrFormat("Scaling in " + trade.Symbol + " at bar %1.0f, entry value = %1.3f", i, trade.GetEntryValue()));
scaleSize = trade.GetEntryValue() / 2;
if (isAqp)
    _TRACE(StrFormat("Profit = %1.3f, Value = %1.3f, price = %1.3f, scaleSize = %1.3f", trade.GetProfit(), trade.GetPositionValue(), trade.GetPrice(i, "C"), scaleSize));
bo.ScaleTrade(i, trade.Symbol, True, trade.GetPrice(i, "C"), scaleSize);
Remember that as newlines are considered white space by the language, one statement can be spread over multiple lines for readability without affecting its operation. The only thing to be aware of is where a single string inside double quotes needs to span multiple lines. White space in a string is treated as exactly what it is, so if you put a line break in the middle of it, you will end up with a line break in your output (this is not true in all languages, but is with AFL as far as tracing goes). Instead, you can split it into two strings and concatenate them:
_TRACE(StrFormat("Profit = %1.3f, Value = %1.3f, price = %1.3f, " + "scaleSize = %1.3f", trade.GetProfit(), trade.GetPositionValue(), trade.GetPrice(i, "C"), scaleSize));
In the end though, this is only for readability purposes. As far as the language goes, it doesn’t matter if a single line is 1000 characters long and scrolls off the right-hand end of the screen. It just makes it more difficult to read the line when you’re working on that part of the code.
There’s little else that can be said about using DebugView for debugging your AFL code. Debugging is something of an art, and knowing what sort of information to trace at which parts of the code is something you’ll get better at the more you do it. Too little information and you can’t tell what’s happening. Too much and it can be like looking for the proverbial needle in a haystack.
Appendix C – Lichello AIM Algorithm
/*     The AIM algorithm is a monthly long position algorithm that buys as
        prices fall and sells as prices rise. It maintains a position control
        amount and then uses a buy safe and sell safe percentage to determine
        how much to buy or sell each month.

        Each stock is treated separately, with its own amount of allocated
        funds. This can be split into an initial purchase amount, which
        becomes the initial position control amount, and a cash component.
        These are the only funds available for the stock. On the last bar of
        each month, the algorithm below is followed:

        - Is the current portfolio value higher than the position control?
        - If so, check if sell any, if not, check if buy any.
        - If sell, calculate Value*(1-sellSafe)-positionControl. That is
          the dollar value of sale.
        - If buy, calculate positionControl-Value*(1+buySafe). That is
          the dollar value of purchase.
        - Check if the amount is greater than the minimum trade value.
        - If sell, check if already maximum cash balance and do vealie if so.
          Vealie is just add sellValue/2 to position control. Otherwise sell
          specified amount as scale-out.
        - If buy, check if sufficient funds available. If not, reduce
          purchase to remaining funds value (minus brokerage). If that is
          still greater than minimum trade, can still buy. Buy calculated
          value of shares as scale-in. Increase position control by buyValue/2.
        - Adjust cash balance of stock to allow for share sale or purchase,
          including brokerage.

        This implementation adds the following:

        - Buy signal for initial purchase based on relative positions of three
          EMAs and slope of the longest period one.
        - After initial purchase, scale-in and scale-out used for all trades.
        - Maximum loss stop used to sell out position if maximum loss reached.
        - Buy signals have random score to help with Monte Carlo testing.

        As the only sell signal is the maximum loss stop, once the initial
        equity has been used up in buying stocks and their cash balances, no
        more stocks will be bought until one of the purchased ones has been
        stopped out.

        This routine tracks the stock quantity and cash balance of each
        stock independantly of the backtester object. It will prevent
        purchases of new stocks if no cash is available even though the
        backtester may still show a positive overall cash balance, as the
        backtester cash balance includes the cash balances of each of the
        purchased stocks. In other words, the cash part of each stock
        position is still kept in the backtester's cash balance but is
        reserved for just that one stock until it gets sold if stopped out.

        The whole AIM algorithm is implemented in the low-level custom
        backtest procedure. The main AFL code just collects the parameters
        and passes them as static variables to the custom backtest procedure,
        and sets up the initial Buy array based on the EMA conditions.

        For more information on the AIM algorithm see the website:

        http://www.aim-users.com

        and follow the links "AIM Basics" and "AIM Improvements".
*/

//===============================================================

/*      Check if the last bar of a calendar month ....

        Checks if the passed bar is the last bar of a calendar month (which does not necessarily mean the last day of the month). It does this by checking if the next bar is in a different month. As it has to look ahead one bar for that, it cannot check the very last bar, and will
        always report that bar as not being the last bar of the month.

        "dn" is the DateNum array
        "bar" is the bar to check
*/

function IsEOM(dn, bar)
{
    rc = False;
    if (bar >= 0 && bar < BarCount-1)
    {
        mm = Int((dn[bar] % 10000) / 100);    //  Month of passed bar
        mmn = Int((dn[bar+1] % 10000) / 100);    //  Month of next bar
        rc = mmn != mm;    //  End of month if not same
    }
    return rc;
}
SetCustomBacktestProc("");    //  Start of custom backtest procedure
if (Status("action") == actionPortfolio)
{
    bo = GetBacktesterObject();
    bo.PreProcess();
    totalCash = StaticVarGet("totalCashG");    //  Get global static variables
    iniPos = StaticVarGet("iniPosG");
    iniCash = StaticVarGet("iniCashG");
    buySafe = StaticVarGet("buySafeG");
    sellSafe = StaticVarGet("sellSafeG");
    minTrade = StaticVarGet("minTradeG");
    maxCash = StaticVarGet("maxCashG");
    maxLoss = StaticVarGet("maxLossG");
    brok = StaticVarGet("brokG");
    monteCarlo = StaticVarGet("monteCarloG");
    dn = DateNum();    //  Array for finding end of month
    for (i = 0; i < BarCount-1; i++)    //  For loop over all bars
    {
        if (IsEOM(dn, i))    //  Scale trades only on last bar of month
        {
            for (trade = bo.GetFirstOpenPos(); trade; trade = bo.GetNextOpenPos())
            {
                qty = StaticVarGet("qty"+trade.Symbol);    //  Current quantity for stock
                poCo = StaticVarGet("poCo"+trade.Symbol);  //  Current position control for stock
                cash = StaticVarGet("cash"+trade.Symbol);    //  Current cash balance for stock
                value = trade.Shares*trade.GetPrice(i, "C");  //  Current stock value
                profit = trade.GetProfit();    //  Current trade profit
                bprice = trade.GetPrice(i+1, "C");    //  Potential buy price (tomorrow's price)
                sprice = trade.GetPrice(i+1, "C");    //  Potential sell price (tomorrow's price)
                if (profit / (iniPos + iniCash) < -maxLoss)    //  If maximum loss reached
                {
                    bo.ExitTrade(i, trade.Symbol, sprice, 1);    //  Exit trade (stopped out)
                    exitVal = cash + qty*sprice - brok;    //  Cash balance after sale
                    totalCash = totalCash + exitVal;    //  Update total system cash
                }
                else
                {
                    if (value > poCo)    //  Increased in value, so look to sell
                    {
                        toSell = value * (1 - sellSafe) - poCo;    //  Value to sell
                        sshares = Int(toSell / sprice);    //  Number of shares to sell
                        if (sshares >= qty || toSell >= minTrade)  //  If more than min or all remaining
                        {
                            if (sshares > qty)    //  Can't sell more than have
                                sshares = qty;
                            sval = sshares * sprice;    //  Actual value to sell
                            if (cash < maxCash)    //  If don't already have max cash
                            {
                                if (cash+sval > maxCash)    //  If sale will give more than max cash
                                {
                                    sval = maxCash - cash;    //  Reduce sale to end with max cash
                                    sshares = Int(sval / sprice);
                                    sval = sshares * sprice;
                                }
                                ishares = trade.Shares;    //  Number of shares have now
                                bo.ScaleTrade(i, trade.Symbol, False, sprice, sval);    //  Sell the shares
                                soldShares = ishares - trade.Shares;  //  Number of shares sold
                                if (soldShares > 0)    //  If actually sold some
                                {
                                    tval = soldShares * sprice;    //  Value of shares sold
                                    StaticVarSet("qty"+trade.Symbol, trade.Shares);  // Store remaining qty
                                    StaticVarSet("cash"+trade.Symbol, cash+tval-brok);  //  And cash
                                }
                            }
                            else    //  Have max cash already so do a vealie
                                StaticVarSet("poCo"+trade.Symbol, poCo+toSell/2);  //  The vealie
                        }
                    }
                    else    //  Decreased in value, so look to buy
                    {
                        toBuy = poCo - value * (1 + buySafe);    //  Value to buy
                        if (toBuy > cash-brok)    //  If don't have enough cash
                            toBuy = cash-brok;    //  Reduce buy to remaining cash
                        if (toBuy >= minTrade)    //  If greater than minimum trade value
                        {
                            bshares = Int(toBuy / bprice);    //  Number of shares to buy
                            bpos = bshares * bprice;    //  Actual value of shares to buy
                            ishares = trade.Shares;    //  Number of shares have now
                            bo.ScaleTrade(i, trade.Symbol, True, bprice, bpos);  //  Buy the shares
                            boughtShares = trade.Shares - ishares;  //  Number of shares bought
                            if (boughtShares > 0)    //  If actually bought some
                            {
                                tval = boughtShares * bprice;    //  Value of shares bought
                                StaticVarSet("qty"+trade.Symbol, trade.Shares);  //  Store new quantity
                                StaticVarSet("poCo"+trade.Symbol, poCo+tval/2);  //  New pos control
                                StaticVarSet("cash"+trade.Symbol, cash-tval-brok);  //  And cash
                            }
                        }
                    }
                }
            }    //  End of for loop over open positions
        }
        for (sig = bo.GetFirstSignal(i); sig; sig = bo.GetNextSignal(i))    //  Check new buys
        {
            doBuy = !monteCarlo;    //  See if ignore for Monte Carlo testing
            if (monteCarlo)
            {
                 rand = Random();
                 doBuy = rand[i] >= monteCarlo;    //  "monteCarlo" is prob of ignoring buy
            }
                          if (doBuy && IsNull(bo.FindOpenPos(sig.Symbol)) && sig.IsEntry() && sig.IsLong() && sig.Price > 0)    //  Can take initial entry signal for stock
                          {
                icash = iniPos + iniCash;    //  Initial cash value for stock position
                if (totalCash < icash)    //  Ignore if not enough portfolio cash
                    break;
                ishares = Int((iniPos-brok) / sig.Price);    //  Initial number of shares to buy
                ipos = ishares * sig.Price;    //  Value of shares to buy
                bo.EnterTrade(i, sig.Symbol, True, sig.Price, ipos);    //  Buy the shares
                trade = bo.FindOpenPos(sig.Symbol);    //  Find trade for shares just bought
                if (!IsNull(trade))
                {
                    tval = trade.GetEntryValue();    //  Value of shares
                    tshares = trade.Shares;    //  Number of shares
                    StaticVarSet("qty"+sig.Symbol, tshares);    //  Store number of shares
                    StaticVarSet("poCo"+sig.Symbol, tval);    //  And position control (share value)
                    cash = iniCash+iniPos-tval-brok;    //  Stock cash balance after purchase
                    StaticVarSet("cash"+sig.Symbol, cash);    //  Store cash balance for stock
                    totalCash = totalCash-iniCash-iniPos;    //  Subtract from portfolio cash
                }
            }
        }    //  End of for loop over buy signals
        bo.HandleStops(i);    //  Shouldn't be any stops
        bo.UpdateStats(i, 1);
        bo.UpdateStats(i, 2);
    }    //  End for loop over bars
    for (trade = bo.GetFirstOpenPos(); trade; trade = bo.GetNextOpenPos())
    {    //  For all open positions at end of test
        qty = StaticVarGet("qty"+trade.Symbol);    //  Number of shares remaining
        poCo = StaticVarGet("poCo"+trade.Symbol);    //  And position control
        cash = StaticVarGet("cash"+trade.Symbol);    //  And stock cash balance
        trade.AddCustomMetric("Shares", qty);    //  Add as metrics to trade list
        trade.AddCustomMetric("Value", qty*trade.GetPrice(BarCount-1, "C"));
        trade.AddCustomMetric("PosCtrl", poCo);
        trade.AddCustomMetric("Cash", cash);
    }
    for (trade = bo.GetFirstTrade(); trade; trade = bo.GetNextTrade())
    {    //  For all closed (stopped out) trades
        poCo = StaticVarGet("poCo"+trade.Symbol);    //  Final position control
        cash = StaticVarGet("cash"+trade.Symbol);    //  And cash balance
        trade.AddCustomMetric("Shares", 0);    //  Add as metrics to trade list
        trade.AddCustomMetric("Value", 0);
        trade.AddCustomMetric("PosCtrl", poCo);
        trade.AddCustomMetric("Cash", cash);
    }
    bo.PostProcess();
}    //  End of custom backtest procedure
//================================================================

//      Start of main AFL code ....

totalCash = Param("1. Total Cash (000)?", 20, 10, 1000, 10);    //  Get parameters
totalCash = totalCash * 1000;
iniPos = Param("2. Initial Position (000)?", 10, 0, 100, 1);
iniPos = iniPos * 1000;
iniCash = Param("3. Initial Cash (000)?", 10, 0, 100, 1);
iniCash = iniCash * 1000;
buySafe = Param("4. Buy Safe?", 10, 0, 100, 1);
buySafe = buySafe / 100;
sellSafe = Param("5. Sell Safe?", 10, 0, 100, 1);
sellSafe = sellSafe / 100;
minTrade = Param("6. Minimum Trade?", 500, 0, 10000, 100);
maxCash = Param("7. Maximum Cash (000)?", 100, 0, 1000, 10);
maxCash = maxCash * 1000;
maxLoss = Param("8. Maximum Loss%?", 20, 0, 100, 1);
maxLoss = maxLoss / 100;
brok = Param("9. Brokerage?", 30, 0, 100, 1);
monteCarlo = Param("10. Monte Carlo%?", 0, 0, 100, 1);
monteCarlo = monteCarlo / 100;

if (monteCarlo)    //  Probability of ignoring buy for Monte Carlo
    Optimize("monteCarlo", 0, 0, 100, 1);    //  For running Monte Carlo test

SetOption("InitialEquity", totalCash);
SetOption("CommissionMode", 2);
SetOption("CommissionAmount", brok);
SetTradeDelays(0, 0, 0, 0);

StaticVarSet("totalCashG", totalCash);    //  Set global static variables
StaticVarSet("iniPosG", iniPos);
StaticVarSet("iniCashG", iniCash);
StaticVarSet("buySafeG", buySafe);
StaticVarSet("sellSafeG", sellSafe);
StaticVarSet("minTradeG", minTrade);
StaticVarSet("maxCashG", maxCash);
StaticVarSet("maxLossG", maxLoss);
StaticVarSet("brokG", brok);
StaticVarSet("monteCarloG", monteCarlo);

e1 = EMA(Close, 30);    //  EMA initial buy conditions
e2 = EMA(Close, 60);
e3 = EMA(Close, 180);
e3s = LinRegSlope(e3, 2);
bsig = e3s > 0 && e1 > e2 && e2 > e3;

Buy = bsig;
Sell = False;    //  Only maximum loss stop to sell

PositionSize = 0;    //  Calculated in custom routine
PositionScore = Random();    //  Random position score for backtesting
The default parameters specified here are the AIM standard values, with $10K initial position, $10K cash, and 10% buy and sell safes. For vealies, the maximum cash balance for a stock defaults to $100K. To experiment with this algorithm in the manner it was intended, try it on individual stocks that have had significant swings but no overall trend. Strongly uptrending stocks will give the best results as the parameters approach buy and hold, with initial cash and buy safe of zero, and sell safe of 100%.
Note that the code uses trade.Shares*trade.GetPrice(i, “C”) for the current value, not trade.GetPositionValue. That’s because the latter function use’s the previous bar’s closing price to determine the current value, whereas we want the current bar’s price (it’s assumed that buy/sell tests are made after the close of trading). The actual prices then used are the next bar’s prices, to mimic making the trade the next trading day. Trade delays are set to zero to avoid confusion and conflict.
To run this code, copy everything in blue to an AFL file and then run it with the backtester. If you run it over a single stock, set the total cash value to be the sum of the initial position and initial cash values (the default setting), otherwise the backtest report won’t give a realistic result for the percentage return (most of the cash would never have been invested so would have zero gain for that component unless an annual interest rate was set). If running it over a portfolio, set the total cash value to be some multiple of the two initial values to allow that many positions to be entered simultaneously. Running it over a large watchlist of stocks will only pick a few positions, depending on the total cash available, with new positions subsequently only being opened if others are stopped out (note that the maximum loss stop is not part of the AIM algorithm, it’s my own addition).
If the backtester results report the trade list, there will only be one entry for each position, no matter how many times it scaled in and out. However, if it got stopped out and the same stock subsequently purchased again, that would show as two trades in the list. To see all the scale in and out trades, run the backtest in Detailed Log mode.
At the end of a backtest, the final quantity of shares, their value, the position control, and the cash balance figures are added to the Trade objects as custom metrics (one or two will be the same as existing metrics though). If the trade was closed, the quantity will be zero.
The parameters include a percentage for Monte Carlo testing. This is the probability of ignoring any particular new buy signal. A value of zero means all buys will be taken, subject to cash availability, while a value of 100 means none will be. The value shouldn’t be set too high otherwise the results might be unrealistic due to a sparsity of trades taken. I’d suggest a value up to 50%, with 25% being what I typically use myself. The less buy signals there are in the Buy array, the lower the value needs to be to avoid giving unrealistic results. To run a Monte Carlo test, set a percentage value and then run an optimisation. The random PositionScore array also helps with Monte Carlo testing.
Finally a disclaimer: while I’ve made every attempt to ensure this correctly implements the AIM algorithm as I have specified in the comments and accompanying text, I can’t guarantee that there are no errors or omissions or that this does in fact implement the algorithm correctly. I have presented it here primarily as a more advanced example of a custom backtest procedure, and all use is at your own risk. However, if you do find any errors, please let me know.
 Filed by brian_z at 10:03 pm under Yahoo
