January 26, 2011
Adding Help-Tips to your programs
If you write AmiBroker programs that are used by others you have undoubtedly found that documenting your program and answering hundreds of emails can be very time consuming. You can save yourself, and those who use your code, a lot of time by adding Help popups (Tips) to your programs. No longer will users have to search though manuals and/or write emails to find basic instructions. Of course you will save time as well since you don’t have to answer all those emails :-) If you don’t program for others, read on, because there are some other applications that may interest you.
When Tips are enabled they will display as a balloon when hovering the cursor over a defined object or area, no clicks are required. Here is a typical Tip:

Tips can be used with gfx Control panels, trading dashboards, charts (function like the interpretation screen and now defunct ToolTip), tabular data, system status displays, gfx menus, caution and alert messages, etc. Your imagination sets the limits. Of course you can change the balloon size, colors, fonts, shape, etc. to your requirements. The code for the trading buttons shown is not provided in this post – that could be another topic.
Tips can display real-time market and system information. In the above example the Last price and a cautionary warning that Transmit is turned ON reflect real-time status.
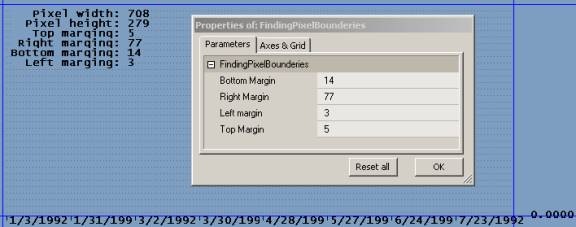
In this post Tips are placed relative to the mouse’s cursor position. In chart applications you might want to use dynamically placed Tips that point to a critical event or condition on your chart. You would do this by converting price and bars to pixels and replace the MX and MY variables in the code with calculated values. For more on this see How to convert from bar-value to pixel coordinates on the AmiBroker Knowledge Base.
When I write button functions I add Tip information as the last argument to the function, this way the information is right where it is defined by the code. This is also helpful when reading the code. The actual Tip text can be repeated in your manual as a text box so that a clear association exists.
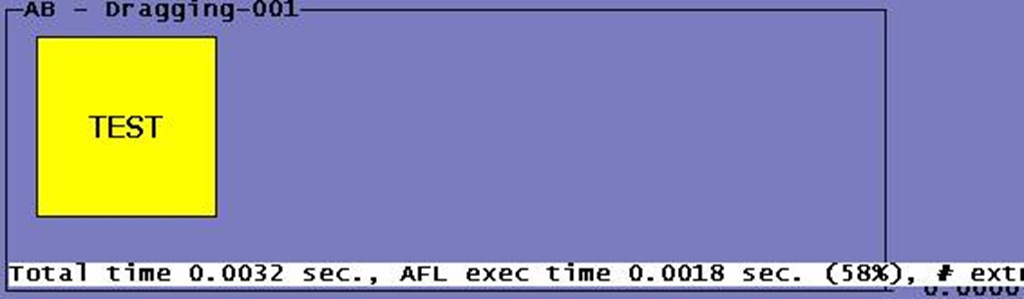
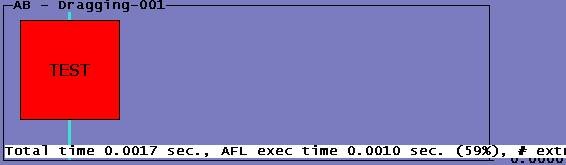
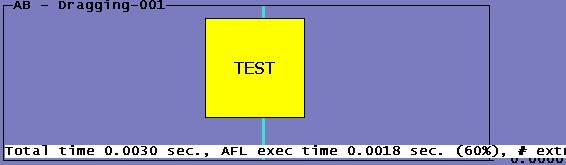
The code in this post demonstrates how the balloon reorients itself depending on in which quadrant of the pane the cursor is located. This is done to keep tips within the pane area, even when hovering over an object close to the edge of the pane. Here is a short video to see how this works.
If, on your computer, the Tip tracks the mouse cursor slower than in the video this is because I have enabled the higher refresh rate of 0.1 second. Tomasz explained this in post 151255 on the main AmiBroker list. Making errors while editing your Registry can cause serious computer problems, if you haven’t done this before, please seek professional help.
All code in this post is solely intended to show you how to develop Tips. They serve no other purpose. To help you experiment I used Param() instead of hard-coding Tip properties:

Have fun!
function ShowTip( TipColor, TipOutlineColor, TipTextColor )
{
global MX, MY, PxWidth, PxHeight, TipWidth, TipHeight, TipsOn, TipFontName, TipFontSize;
TipMsg = VarGetText( "TipMsg" );

if ( TipsOn AND TipMsg != "" )
{
Quadrant = ( MX < pxwidth / 2 ) + ( MY < pxheight / 2 ) * 2;
D  = 30; // Rounding Diameter

switch ( Quadrant )
{

case 3:
X1 = MX;
Y1 = MY + D * 0.75;
X2 = MX + TipWidth;
Y2 = MY + TipHeight + D * 0.75;
X3 = MX + D * 0.75;
Y3 = Y1;
X4 = MX + D * 2;
Y4 = Y1;
X5 = MX;
Y5 = MY;
break;

case 2:
X1 = MX - TipWidth;
Y1 = MY + D * 0.75;
X2 = MX;
Y2 = MY + TipHeight + D * 0.75;
X3 = MX - D * 0.75;
Y3 = Y1;
X4 = MX - D * 2;
Y4 = Y1;
X5 = MX;
Y5 = MY;
break;

case 1:
X1 = MX;
Y1 = MY - TipHeight - D * 0.75;
X2 = X1 + TipWidth;
Y2 = Y1 + TipHeight;
X3 = MX + 2 * D;
Y3 = Y2 - 1;
X4 = MX + D * 0.75;
Y4 = Y2 - 1;
X5 = MX;
Y5 = y2 + D * 0.75;
break;

case 0:
X1 = MX - TipWidth;
Y1 = MY - TipHeight - D * 0.75; // Rectangle
X2 = X1 + TipWidth;
Y2 = Y1 + TipHeight;
X3 = X2 - 2 * D;
Y3 = Y2 - 1; // Pointer
X4 = X2 - D * 0.75;
Y4 = Y2 - 1;
X5 = X2;
Y5 = y2 + D * 0.75;
break;

default:
x1 = x2 = x3 = x4 = x5 = y1 = y2 = y3 = y4 = y5 = 0;
}

GfxSetBkMode( 0 );

GfxSelectPen( TipOutlineColor );
GfxSetTextColor( TipTextColor );
GfxSelectFont( TipFontname, TipFontSize );
GfxSelectSolidBrush( TipColor );
GfxRoundRect( X1, y1, x2, y2, D, D );
GfxPolygon(   X3, Y3 , X4 , Y4, X5, Y5 );     // Pointer
GfxSelectPen( TipColor ); // Hide line between RoundRect and Pointer
GfxMoveTo( X3, Y3 );
GfxLineTo( X4, Y4 );
GfxDrawText( TipMsg, x1 + 10, y1 + 3, x2 - 10, y2 - 5, 16 + 65 );
}
}

function TestObject( Label, X1, Y1, X2, Y2, Color ) // Do-Nothing Demo function only
{
GfxSelectPen( colorBlack );
GfxSelectSolidBrush( Color );
GfxRectangle( X1, y1, x2, y2 );
OverObject = MX > x1 AND MX < x2 AND MY > y1 AND MY < y2;

if ( OverObject )
VarSetText( "TipMsg", "The cursor is now over the " + Label +
" quadrant and the shape of the Tip is adjusted accordingly." );

return OverObject;
}

// Global variables and parameters can be hard-coded in the final application
global MX, MY, PxWidth, PxHeight, TipWidth, TipHeight, TipsOn, FontName, FontSize;
TipColor          = ParamColor( "Tip Background Color", colorWhite );
TipOutlineColor = ParamColor( "Tip Outline Color", colorBlack );
TipTextColor   = ParamColor( "Tip Text Color", colorBlack );
TipsOn             = ParamToggle( "Tips On", "OFF|ON", 1 );
TipFontSize    = Param( "Font Size", 9, 0, 24, 1 );
TipWidth          = Param( "Tip Width", 220, 50, 500, 10 );
TipHeight         = Param( "Tip Height", 80, 50, 500, 10 );
TipFontName       = ParamStr( "Tip Font name", "Lucida Console" );

GfxSetBkMode( 1 );
GfxSetOverlayMode( 0 );
RequestTimedRefresh( 0.1 );
MX         = GetCursorXPosition( 1 );
MY         = GetCursorYPosition( 1 );
PxWidth    = Status( "pxwidth" );
PxHeight    = Status( "pxheight" );

// In a real application each colored area could be s small button
TestObject( "UpperLeft", 0, 0, pxwidth / 2, pxheight / 2, colorRed );
TestObject( "UpperRight", pxwidth / 2, 0, pxwidth, pxheight / 2, colorBlue );
TestObject( "LowerLeft", 0, pxheight / 2, pxwidth / 2, pxheight, colorYellow );
TestObject( "Lowerright", pxwidth / 2, pxheight / 2, pxwidth, pxheight, colorBrightGreen );

ShowTip( TipColor, TipOutlineColor, TipTextColor ); // Place this call at the very endo of your code
 Filed by Herman at 4:25 pm under GFX Programming
Comments Off on Adding Help-Tips to your programs