February 18, 2008
Real-Time Bar Period Timing
When trading in real-time, one often needs to know when a new period starts and how much time there is left before the period ends. The code below will give you the time remaining to the next bar, the time elapsed since the start of the bar, and the second count since date-change. The timing values will automatically adjust to the selected chart interval. You can use the variables in your system’s code to time various events.
This code is shown in a demo configuration, and you will have to adapt it to your personal requirements. To test, simply Apply the code to an Indicator window. For a quick test, select the one-minute time interval.
function GetSecondNum()
{
    Time         = Now( 4 );
    Seconds     = int( Time % 100 );
    Minutes     = int( Time / 100 % 100 );
    Hours     = int( Time / 10000 % 100 );
    SecondNum = int( Hours * 60 * 60 + Minutes * 60 + Seconds );
    return SecondNum;
}

RequestTimedRefresh( 1 );
TimeFrame = Interval();
SecNumber = GetSecondNum();
Newperiod = SecNumber % TimeFrame == 0;
SecsLeft     = SecNumber - int( SecNumber / TimeFrame ) * TimeFrame;
SecsToGo     = TimeFrame - SecsLeft;

if ( NewPeriod )
{
    Say( "New period" );
    Plot( 1, "", colorYellow, styleArea | styleOwnScale, 0, 1 );
}

Title = "\n" +

        "  Current Time: " + Now( 2 ) + "\n" +
        "Chart Interval: " + NumToStr( TimeFrame, 1.0 ) + " Seconds\n" +
        " Second Number: " + NumToStr( SecNumber, 1.0, False ) + "\n" +
        "  Seconds Left: " + NumToStr( SecsLeft, 1.0, False ) + "\n" +
        " Seconds To Go: " + NumToStr( SecsToGo, 1.0, False );

Plot( C, "", 1, 128 );
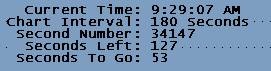
For verification, timing is displayed in the chart title:
Edited by Al Venosa.
 Filed by Herman at 2:31 pm under Real-Time AFL Programming
Comments Off on Real-Time Bar Period Timing