October 14, 2011
EOD Gap-Trading Portfolio system
Added February 29, 2012, additional points to consider:
1) This system depends on getting accurate fills at the Open price. To obtain such fills requires a quality minimum-delay data feed and advanced programming skills to implement trade-automation.
2) When setting the entry price slightly below the Open price (trying to improve performance) the system fails miserably. Even improving the price by just one cent kills the system. This suggests that most of the profit comes from days on which the Open price was equal to the daily Low, i.e., the price moved up from the Open and never dropped below it. This, of course, is obvious. To confirm this I added this test condition (it looks ahead) to exclude days on which Open == Low:
Buy = Buy AND NOT O == L;
This kills the system and proves that most of the profit comes from days where O==L. To further confirm this I added the opposite condition:
Buy = Buy AND O == L;
This gives nearly infinite profits and proves that most profits come from days on which the price moves up immediately from the Open and never returns below it. Trying to improve the entry price is a mistake; one should enter on a Stop set 1-2 ct above the Open price, this will eliminate days when the price drops and never turns back. This improves performance significantly.
3) This system trades knee-jerk trader-responses/patterns. Such patterns are usually drowned by large volume trading hence this system works far better when you select tickers with volumes between 500,000 and 5,000,000 shares/day. This also improves performance significantly.
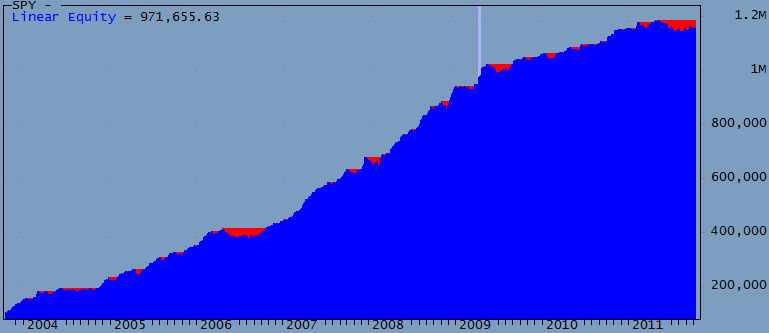
Adding the above two features results in an equity curve much better than that shown below. Sorry, I have no time to document the above in greater detail. Good luck!
The original post:
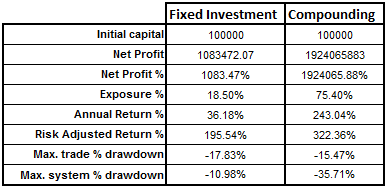
This post outlines a very simple Long-only trading idea that Buys at a given percentage below yesterday’s Low, and exits at the next day’s Open. While sometimes it may be difficult to get the exact Open price, the high profitability of this system makes it a good candidate for further experimentation. The system works well with Watchlists like the N100, SP500, SP1500, Russel 1000, etc. Performance on the Russel 1000, with max. open positions set to 1, for the period 12/10/2003 to 12/10/2011, looks like this:


Some of the other Watchlists give less exposure (profits) but this comes with lower DDs. Commissions were set to $0.005 per share. No margin used.
No explicit ranking is used; tickers are traded based on their alphabetical sort in the Watchlist. This may seem odd but is significant: reversing this sort the system fails. This might mean that, due to real-time scanning problems, symbols listed at the top of this sort may be traded differently than those listed at the bottom.
Pay attention to Liquidity (you might want to trade more than one position) and slippage (Entry is rather risk-free, but exits may be problematic). DDs are significant but may be offset with improved real-time traded entries and exits. When trading automatically it may be possible to place OCA DAY-LMT entry orders for all signals and just wait and see what fills. Since exits are more difficult than entries you may wish to explore other exit strategies.
Parameter default values are just picked out of a hat. Almost certainly you can Optimize them or adjust them dynamically for individual tickers. I briefly tested this system in Walk-Forward mode and the results were profitable for all years tested. Except for the number of stocks traded parameters appear not very critical. Over-optimizing doesn’t seem a problem in this case.
The code below is very simple and requires few explanations. However it is important to understand that this system enjoys a small edge by trading at the Open, and by calculating the TrendMA using the same Open price. Some might interpret this as future leak, however if you trade this system in real-time, it is not. Many people do not realize that if you trade at the Open you can also use this price in your calculations — as long as you perform them in real-time — this is where AmiBroker and technology can give you an edge. If you Ref() back the TrendMA by one bar the system is still very profitable however DDs increase for some Watchlists. If you use fixed investments the difference is negligible.
The trading procedure would be to start scanning before the market opens and remove tickers that are priced so remote that they are unlikely to meet the OpenThresh. Thus you may start scanning 1000 symbols but very quickly the number scanned will dwindle to just a dozen or so tickers. When you approach 9:30am your real-time scan will be very fast and you will be able to place your LMT order very close to the Open – you may even be able to improve on the Open price.
Even though a few people looked at the code below and found nothing wrong, the profits seem rather high for such a simple system. Please report errors you may see.
function ParamOptimize( description, defaultVal, minv, maxv, step )
{
    return Optimize( description, Param( description, defaultVal, minv, maxv, step ), minv, maxv, step );
}

PosQty = ParamOptimize( "Position Qty", 1, 1, 10, 1 );
TrendPeriod = Paramoptimize( "Pd1", 13, 3, 30, 1 );
OpenOffset = paramOptimize( "OS", 0.99, 0.98, 1, 0.001 );
MinVolume = ParamOptimize( "Min. Volume (M)", 0.5, 0.5, 10, 0.5 );

Short = Cover = 0;
SetOption( "allowsamebarexit", False );
SetOption( "maxopenpositions", PosQty );

VolumeOK = MA( Ref( V, -1 ), 10 ) > MinVolume;
TrendMA = MA( O, TrendPeriod );
ROCTrend = ROC( TrendMA, 1 );
TrendUp = ROCTrend > 0;
OpenThresh = Ref( L, -1 ) * OpenOffset;

Buy = O < OpenThresh AND VolumeOK AND TrendUp;
BuyPrice = O;

Sell = Ref( Buy, -1 );
SellPrice = O;

PositionSize = -100 / PosQty;  // Compounded
//PositionSize = 100000;   // Fixed investment

Plot( C, "", 1, 128 | styleThick );
Plot( TrendMA, "", 2, 1 );

if ( ParamToggle( "Triangles", "HIDE|SHOW", 1 ) )
{
    PlotShapes( IIf( Buy,     shapeSmallCircle, shapeNone ), 5, 0, BuyPrice, 0 );
    PlotShapes( IIf( Sell,    shapeSmallCircle, shapeNone ), 4, 0, SellPrice, 0 );
}
 Filed by Herman at 7:03 pm under Ideas (Experimental)
Comments Off on EOD Gap-Trading Portfolio system
