February 14, 2011
Designing a Real-Time Trading Dashboard
In this category I will document my progress in developing a Real-Time Trading Dashboard (TDash). This is a one-man project and it will strongly reflect my personal needs and likes. Posts will appear as significant parts are completed. There may be many revisions and you should expect some bugs. My primary reason for sharing this work is to try and introduce some new ways of doing things.
No doubt, if you inspect my code, you will come across many code snippets and techniques you have seen before. While I respect proprietary code, I readily make use of code I find in the public domain. I herewith say “Thank You” to all those who answer questions and share code on the public forums; without their generosity I might not have taken on this project.
This is an advanced project and, when all is working as planned, the program could contain several thousand lines of code. It may take several months for the project to reach functionality. Since it would take too much time to explain everything in detail, focus will be on explaining ideas and on showing you how to use the functions developed. At this time code is written for single stock and single system operation.
Designing a Real-Time Trading Dashboard (TDash) may seem simple at first glance but once you start you’ll discover there are many problems to solve. There are so many different ways to go about it that just deciding on the best way often takes a significant amount of time. In fact it often takes more time to decide on how to do things than to write the code.
I tried to consult other traders on what are desirable features, however, almost everyone wants things done differently. To save time I decided to just do it my way. Most features can easily be adjusted and you are encouraged to use ideas and code you like, and develop your own TDash.
Some may tell you that the TWS offers everything they need and, for some traders, this may be so. Please explore the advanced features of the TWS before rejecting it, it does have a lot of hidden features.
The TDash system will have one program for the TDash window, one for the Main Chart window, and one or more include files. When you look into the include files, you may see functions which are not called at this time. Some of these unused function are still in their development stage. Unless you use #Pragma NoCache, the length of the include files will not significantly affect your program’s execution time.
Work will be divided into two major parts: The graphical interface (gfx) and order processing for Bar-Replay, and the IBc.
My personal design objectives are:
- Produce a least-effort and low-stress Real-Time Trading Dashboard. Above all, it must be fun and intuitive to use.
- It will be designed for fast (minute time frame) Intraday trading, but it should also be useful in EOD trading.
- Consolidate all trading controls (for IBc/TWS), System setup, and Chart management in a single graphical user interface executing in its own window.
- Place orders and set prices with reference to the main chart, i.e., not by entering prices on a TWS executing on another monitor.
- Have all code in include files so that the Trading Dashboard can be used with any main chart and is easily updated.
- Allow it to be used with an Interactive Brokers account, and in Bar-Replay.
- The project will initially be designed to trade a single stock. Portfolio features may be added later.
- Eventually I would like to add features that would make using the Trading Dashboard feel like playing a video game, i.e., it should provide trading hints (rules) and performance feedback to promote better trading.
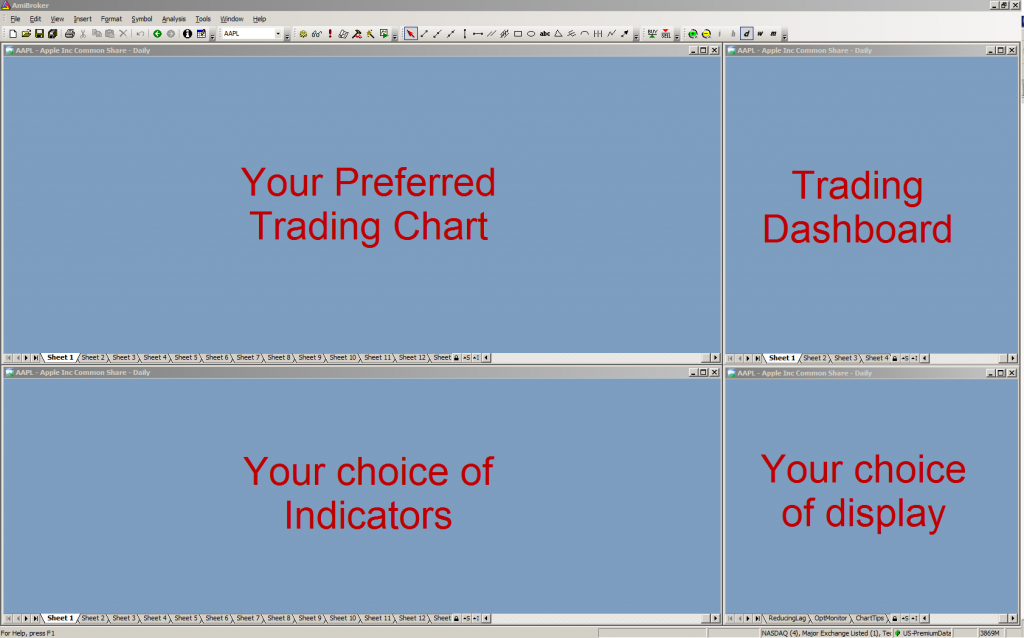
Deciding on a Layout
The Layout below shows four windows, but you can use as many as you like. The only requirement is that the TDash is to your right of the main chart and that these two windows are accurately aligned at the top of the AmiBroker window.
To be able to drag orders and price markers in one window, and have the prices accurately reflected in another, they must share a common reference. I will use AmiBroker’s upper window edge for common reference. This requires that both windows are accurately aligned at the upper edge of the window. This is easily done by dragging windows by their upper edge or corner until they meet the top of the AmiBroker window.
The Trading dashboard is located to the right of the main chart. These are the only Layout requirements that you must adhere to.
The first requirement is to develop code that links both windows so that dragging a price marker in the TDash window will track a price-line in the main chart and, if the main chart scales up or down, the markers in the TDash window track the price in the Main Chart. This two-way tracking must work independent of the settings of the TDash window (Ticker, zoom condition, Y-axis range, etc.). The next post will show how this can be done.
For best performance, you should enable the higher chart refresh rates. Tomasz explained how to do this in post 151255 on the main AmiBroker list. Please read the correction in comments below. Making errors while editing your Registry can cause serious computer problems, if you haven’t done this before, please seek professional help.
 Filed by Herman at 6:25 pm under Developing a RT Trading Dashboard
Comments Off on Designing a Real-Time Trading Dashboard


