January 21, 2007
DebugView: Introduction and Setup
DebugView is an essential development, debugging, and trading tool.
When developing Automated Trading Systems, you need to know when orders have gone out, what their parameters were, whether they were accepted and processed, what error messages were received, etc. When you place an automated order, you cannot simply assume that your order was executed and filled. You must always verify order and system status and be able to act on irregularities.
Debugging techniques reflect personal working habits, and the examples you’ll find in the Debug Category of the Users’ Knowledge Base are intended to help you develop your own debugging strategies, not to provide the perfect debugging setup for you.
Using _TRACE() statements will slow down the speed of code executions somewhat, and you should exercise care when using them. For example, you should never permanently embed _TRACE() statements inside a loop with a thousand iterations. This would result in thousands of lines being output to DebugView and noticeably slow down your AFL execution. Another option is to selectively enable and disable _TRACE() output by using the Param() user input; this topic is covered under the heading of DebugView: _TRACE() Statements and Logging.
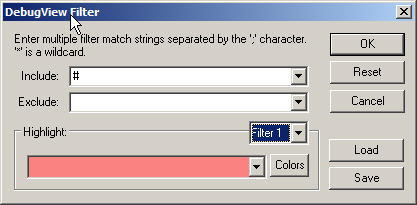
You can use DebugView to create a detailed logging file that will show you exactly what happened, when it happened, and in what sequence. To reject output from other programs on your computer, all _TRACE() output strings start with a “#” character. This is done so that you can set up your DebugView -> Edit -> Filter/HighLight to pass only your statements that begin with “#”:
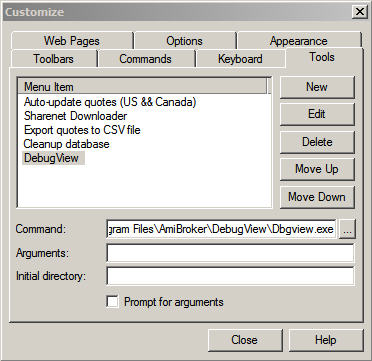
To install DebugView, download, unzip, and copy the dbgview.exe program to the C:\Program Files\AmiBroker\DebugView folder. Then, in AmiBroker, go to Tools -> Customize -> Tools -> New and change MenuItem to DebugView. Next, click on the three dots inside the Command box and browse for the DebugView program, which is located at C:\Program Files\AmiBroker\DebugView\Dbgview.exe, and click on it. Finally, click the Close button, and you are finished. From now on, you can start up DebugView from AmiBroker by simply clicking Tools -> DebugView.
It cannot be stressed enough that DebugView is an indispensable tool in the development of Real-Time Automated trading systems.
DebugView is free, and you can download it from http://www.microsoft.com/technet/sysinternals/utilities/debugview.mspx
Edited by Al Venosa
 Filed by Herman at 12:55 am under Debugging AFL
Comments Off on DebugView: Introduction and Setup