August 30, 2007
BarCount versus BarIndex
 Filed by brian_z at 2:47 am under AFL - The Basics
Comments Off on BarCount versus BarIndex
Users' Knowledge Base
ATTENTION: THIS SITE IS OBSOLETE. FOR CURRENT INFORMATION USE www.amibroker.com/kb
|
Filed by brian_z at 2:47 am under AFL - The Basics
Comments Off on BarCount versus BarIndex
Filed by brian_z at 2:05 am under User Interface
Comments Off on Combination Charts
This is the first in a series off KISS (keep it simple, stupid) trading ideas for you to play with. All system ideas presented here are unproven, unfinished, and may contain errors. They are intended to show possible patterns for further exploration. As always, you are invited to make comments and/or add your own ideas to this series.
I prefer real-time systems that trade fast, are automated, and are devoid of traditional indicators. Preferably, they should have no optimizable parameters; however, I may not always be able to meet this objective. Not all systems will be ‘that’ simple; there will be some that use simple averaging or HHV/LLV type functions. The first system shown below is a copy of the demo system I use to develop Trade-Automation routines elsewhere on this site.
Real-Time Gap-Trading.
To see how this works, you should Backtest it on 1-minute data with a periodicity in the range of 5-60 minutes. Your first impression may be that these profits are simply due to an up market, however, the fact that Long and Short profits are about equal suggests there is more to it. Because 98% of all trades fall between 9:30 AM and 10:30 AM, this type of system is nice if you just want to trade a short time each day. This reduces risk with respect to market exposure and gives you more time to enjoy other activities.
SetOption("CommissionMode",3);
SetOption("CommissionAmount", 0.005);
SetTradeDelays(0,0,0,0);
Buy = O < Ref(L,-1);
BuyPrice = O;
Sell = L < Ref(L,-1);
SellPrice = C;
Short = O > Ref(H,-1);
ShortPrice = O;
Cover = H > Ref(H,-1);
CoverPrice = C;
E=Equity(1);
Plot(C,"",1,128);
if( PlotTriangles = ParamToggle("Triangles","HIDE|SHOW",1) )
{
PlotShapes(IIf(Buy, shapeSmallUpTriangle, shapeNone),5,0,BuyPrice,0);
PlotShapes(IIf(Sell, shapeHollowDownTriangle, shapeNone),4,0,SellPrice,0);
PlotShapes(IIf(Cover, shapeHollowUpTriangle, shapeNone),5,0,CoverPrice,0);
PlotShapes(IIf(Short, shapeSmallDownTriangle, shapeNone),4,0,ShortPrice,0);
}
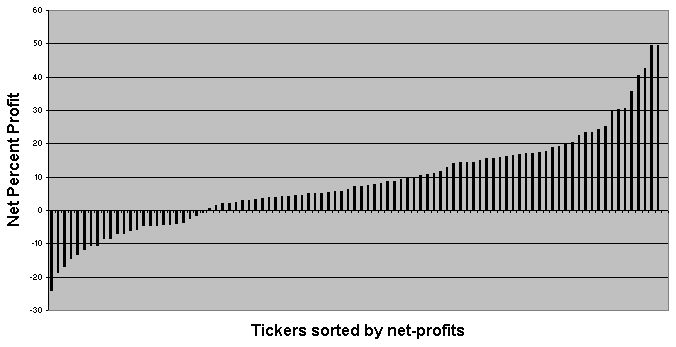
Backtesting this on the NASDAQ-100 watchlist (individual backtests, 15 min. Periodicity) gives the profits shown below for the period of 1 MAR 2007 to 17 AUG 2007. Ticker names are omitted to keep the chart compact; the chart simply shows a net profit bar for each ticker tested. Average exposure for this system is about 15%; hence, you may be able to trade portfolios to increase profits and smooth the equity curves. Be cautioned that in its raw form the drawdowns are unacceptable and that there may be volume restrictions for many tickers.
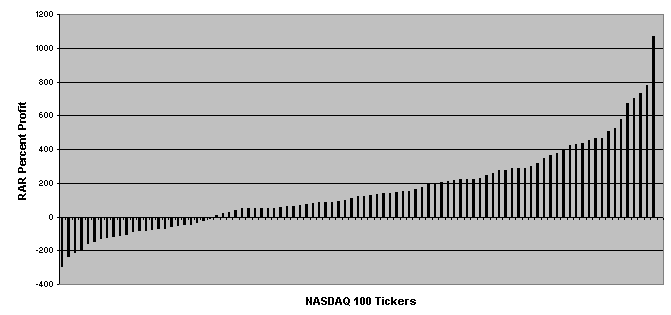
Since this system has low exposure, it may be a candidate for market scanning and ranked portfolio trading. RARs would be an indication of the absolute maximum profits that could be obtained if one succeeded to increase exposure to near 100%. However, price movement from different tickers may be correlated, and trades from different tickers may overlap. If many tickers trade at the same time, it would be difficult to increase system exposure.
Edited by Al Venosa.
Filed by Herman at 1:49 pm under Ideas (Experimental)
Comments Off on KISS-001: Intraday Gap Trading
This post shows how to add intraday session timing to the Real-Time Gap-Trading (RTGT) system developed in the previous post. However, before tackling session timing, there are a few things you should be aware about:
In real-time trading there are many functions that are timed with reference to your system’s clock. It is therefore imperative that you always synchronize your computer clock with an Internet timeserver before each trading session.
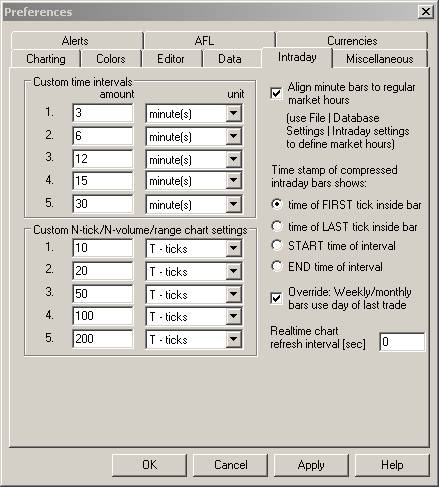
Data Timestamps can be aligned to either the start or the end of the base period. The code developed here uses time of FIRST tick inside bar, i.e., the data timestamp returns the time at the start of the bar. This is when the first quote for the new period arrives and defines the Open for the new bar. Click Tools -> Preferences -> Intraday to set this option:
During backtesting the timing resolution will be equal to the periodicity set in AA Settings. If you are comparing Backtester signals with the signals displayed on your chart, you must make sure that the AA and Chart use the same periodicity.
During Bar Replay the timing resolution will be equal to the greater of the base interval of your database or the Step Interval selected in the Bar-Replay window.
During Backtesting and Bar-Replay, AmiBroker will refer to the timestamp to know how prices change over time. Hence, you will have no choice but to time events, such as session timing, with reference to the data timestamp.
When trading from an Indicator, the data timestamp is rounded to the selected chart-periodicity, i.e., if you display a 1-minute chart, the timing resolution will be one minute. This means you cannot implement delays based in seconds using the data timestamps of a minute database. This is why most functions in a real-time trading system use the computer clock as reference.
You can, with caution, use either the data timestamp or the system’s clock to control your session. However, since the data timestamp is dependent on the arrival of new quotes (ignoring data padding), using data timestamp could be unreliable. If you want higher timing resolution, you could create a 5-second database. However, this means working with slow backfills and slow AFL executions, due to lengthy data histories. To keep things simple, we will use a one-minute database.
When you are developing real-time trading systems, it is often handy, even essential sometimes, to develop several code versions. Typically, these might include:
1) A version for Backtesting and Bar-Reply. This version would use the TimeNum function for timing.
2) A Real-Time trading version. This version would use the system clock (Now()) for timing and would be highly optimized for AFL execution speed.
3) A DebugView version. This is a useful intermediate development stage that lets you run your system in real-time without any TWS interfacing; it logs trades to DebugView instead of sending them to the TWS.
ParamTime() input statements are used to set the start- and end-time of the trading session. The code below is only intended for preliminary system evaluation using the Backtester: hence, is uses time-numbers for session timing.
The StartOfSession and EndOfSession variables are triggers (they last only one bar). They are used to initialize processes at the start of the session and clean up processes at the end of the session. The InSessionTime variable is True during trading and is used to control processes that must be turned On/Off depending on whether you are trading or not. These processes will be covered in future posts.
A TimeFrame Parameter has been added to help visualize how the system works in different timeframes. To see the equity for different timeframes, just drag the slider to see the system response to any timeframe from 1 minute to 1 hour. Having added Session Timing you can now explore whether this system is more profitable during certain hours of the trading day. I suggest you perform an individual backtest on you favorite watchlist; you may be surprised to find that with some systems there is no need to trade all day. More…
For debugging purposes, you can turn On/Off a colored ribbon to display the Start- (Green), End- (Red) and In-Session (Yellow) variables.
For convenience the code below includes all previously developed parts. Just copy to an Indicator formula window, and click Apply.
<p>_SECTION_BEGIN("SESSION TIMING"); <p>TimeFrame= Param("Chart Timeframe (min)",1,1,60,1)*60; <p>TimeFrameSet(TimeFrame); <p>TN = TimeNum(); <p>ParamStartTime = ParamTime("Session Start","09:30:00"); <p>ParamEndTime = ParamTime("Session End","15:59:00"); <p>InSessionTime = TN >= ParamStartTime AND TN <= ParamEndTime; <p>StartOfSession = InSessionTime > Ref(InSessionTime,-1); <p>EndOfSession = InSessionTime < Ref(InSessionTime,-1); <p>InsessionTime = InSessionTime OR EndOfSession; <p>_SECTION_END(); <p>Buy = O < Ref(L,-1) AND InsessionTime; <p>BuyPrice = O; <p>Sell = L < Ref(L,-1) OR EndOfSession; <p>SellPrice = C; <p>Short = O > Ref(H,-1) AND InsessionTime; <p>ShortPrice = O; <p>Cover = H > Ref(H,-1) OR EndOfSession; <p>CoverPrice = C; <p>SetTradeDelays(0,0,0,0); <p>SetOption("CommissionMode",3); <p>SetOption("CommissionAmount", 0.005); <p>E=Equity(1); <p>TradeEquity = ValueWhen(Sell OR Cover,E); <p>_SECTION_BEGIN("PLOTTING"); <p>Plot(C,"",1,128); <p>if( ParamToggle("Session Timing Ribbons","HIDE|SHOW",0) ) <p>{ <p>Plot( InSessionTime,"",7,styleArea|styleOwnScale|styleNoLabel,0,60); <p>Plot( StartOfSession,"",5,styleArea|styleOwnScale|styleNoLabel,0,30); <p>Plot( EndOfSession,"",4,styleArea|styleOwnScale|styleNoLabel,0,30); <p>} <p>OutOfSessionColor = ParamColor("Out of Session",colorDarkRed); <p>Plot(NOT InSessionTime,"",OutOfSessionColor,styleArea|styleOwnScale|styleNoLabel,0,1); <p>PlotShapes(IIf(Buy, shapeSmallUpTriangle, shapeNone),5,0,BuyPrice,0); <p>PlotShapes(IIf(Sell, shapeHollowDownTriangle, shapeNone),4,0,SellPrice,0); <p>PlotShapes(IIf(Cover, shapeHollowUpTriangle, shapeNone),5,0,CoverPrice,0); <p>PlotShapes(IIf(Short, shapeSmallDownTriangle, shapeNone),4,0,ShortPrice,0); <p>if(ParamToggle("Equity curve","HIDE|SHOW",0) ) <p>{ <p>Plot(TradeEquity,"",2,styleStaircase|styleOwnScale); <p>}
Filed by Herman at 2:07 pm under Real-Time System Design
Comments Off on Gap-Trading demo, Session Timing Example
You are invited to submit links to system ideas in comments to this post.
Gap Trading Strategies – Stockcharts
Intraday Moving Average Crossover with Position Sizing – NeoTicker
Volatility-Breakout-Systems – Traders Log
Ten day High/Low system – StockWeblog
Reversion Systems – SeekingAlpha
Systems Traders Club: Trader Club Bulletins.
Filed by Herman at 7:46 pm under Trading Systems
Comments Off on System Ideas on the Internet
This page is obsolete. Current versions of AmiBroker feature built-in non-exhaustive, smart multithreaded optimizer and walk-forward engine.
As stated previously IO Directives will by definition be seen as comments by AB / AA / AFL and are thus unintrusive. Below is a simple AFL with the required IO Directives in it.
ShrtLen    = Optimize("ShrtLen",         2,     0,   500,     1);
LongLen    = Optimize("LongLen",       304,     0,   500,     1);
UpPct      = Optimize("UpPct",        0.01,     0,    10,  0.01);
DnPct      = Optimize("DnPct",        0.36,     0,    10,  0.01);

ShrtAMA = AMA(C, 2 / (ShrtLen + 1));
LongAMA = AMA(C, 2 / (LongLen + 1));

if (ShrtLen < LongLen)
{
    Buy     = Cross(ShrtAMA, LongAMA * ( 1 + UpPct / 100 ));
    Sell    = Cross(LongAMA * ( 1 - DnPct / 100 ), ShrtAMA);

    Short   = Sell;
    Cover   = Buy;
}
That’s right … There aren’t any required directives.
IO was meant to be a tool for USERS.
All the IO Directives are optional as they all have default values, all of which with a few notable exceptions I have set to what I believe the best settings to be are. As a result there is no learning curve to climb in order to run IO.
Getting the most out of IO by utilizing sensitivity testing during in sample optimization and performing walk forward testing does require knowledge of how to write those directives which anyone should be able to get up to speed on in a few minutes.
Initial setup of IO involves copying the IO Tasks.hta, IO.exe and IO.ico files from a zip to your AmiBroker directory. Following that one would want to set up easy access to the IO Task Bar as it is the control center for all IO operations. This can be from the AmiBroker, Tools, Custom menu or from the Windows Desktop or Quick Launch Bar ( My preference because its a single click ). Once that’s established, clicking on the icon for the IO Task Bar will bring it up in the top left corner of the screen typically overlaying the AmiBroker title bar. It can of course be moved to wherever the user desires.
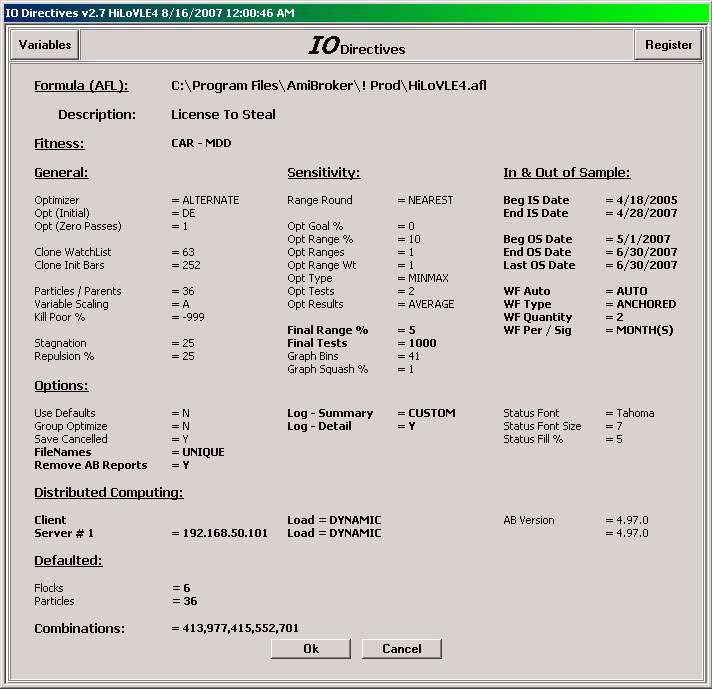
Clicking RUN on the IO Task Bar will start an IO run much like clicking Optimize in AB/AA or FE would start a regular AmiBroker optimization. When IO begins it will first show the user the values for all the IO Directives, with the ones not having default values being in bold. This provides the user a chance to review the directives and cancel the run prior to its beginning if modification to some directive is desired.
Once the user clicks OK on the Directives screen, optimization begins. What one would see during optimization is short bursts of the AB Optimization progress bar which will appear, run to completion, disappear and then repeat. IO is only active for very short spans of time, typically a fraction of a second, between the time that the AB Optimization progress bar disappears and when it reappears.
Other options from the IO Task Bar while IO is running are …
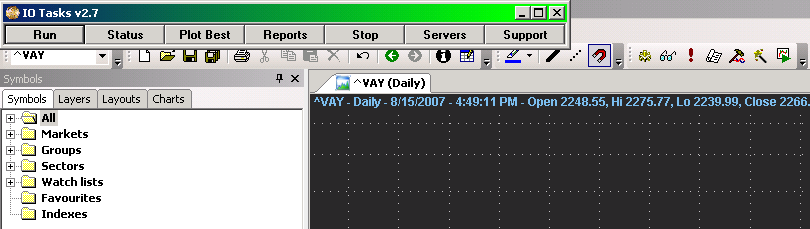
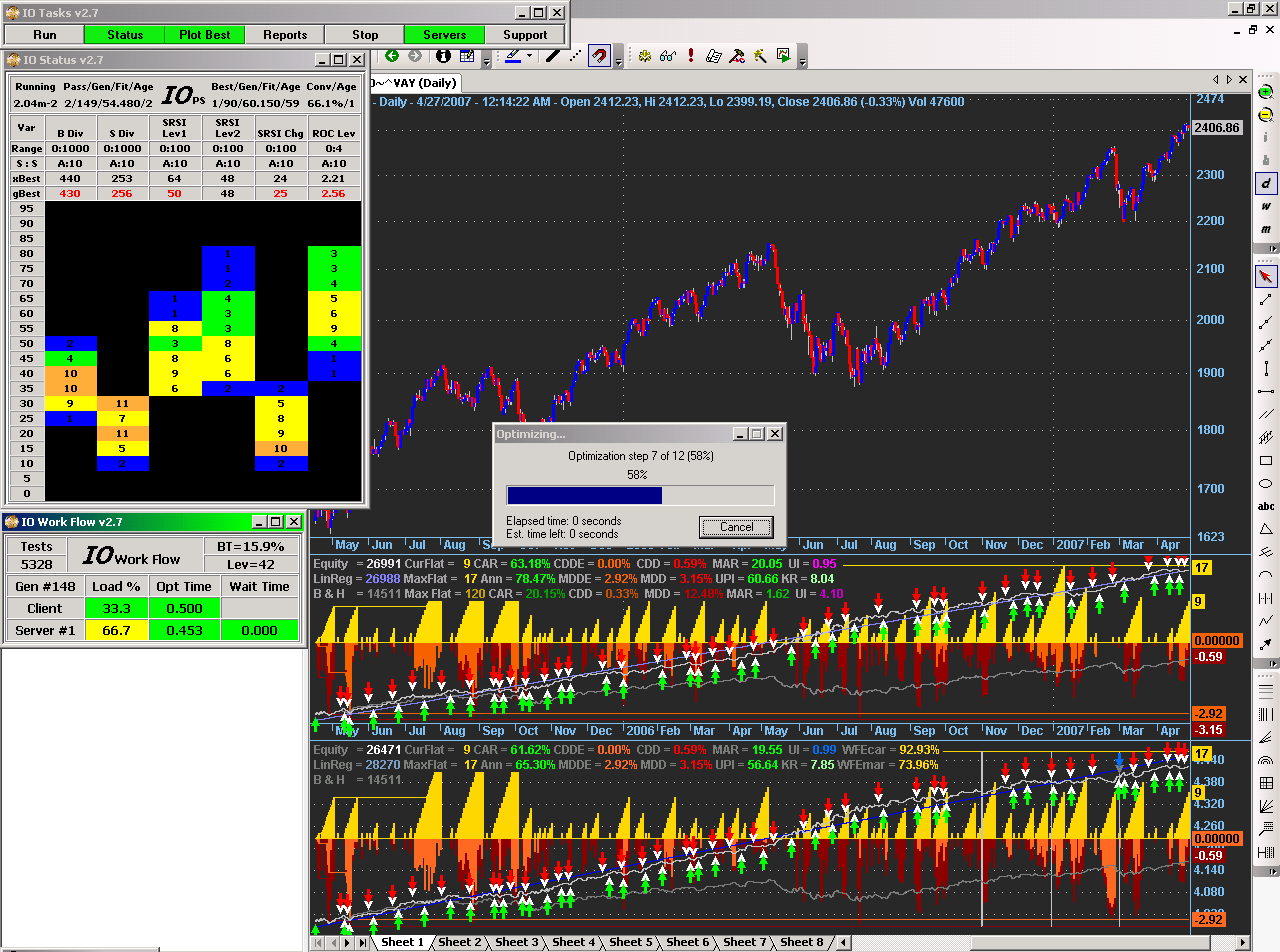
– Status – Shows the status of the run ( Shown Above )
– Plot Best – Will automatically update an Equity Curve ( AB’s, Yours or Mine ) as new best solutions are found
– Stop – Will allow the run to be paused or cancelled
– Servers – Shows the Work Flow between client and server(s) ( Shown Above )
IO Task Bar On/Off Type Buttons will change color when activated as shown above. When a run is completed the equivalent of clicking the Reports button will occur which is to provide GUI access to all the Reports and Screens relative to the current and previous runs.
This is the initial screen that will display:
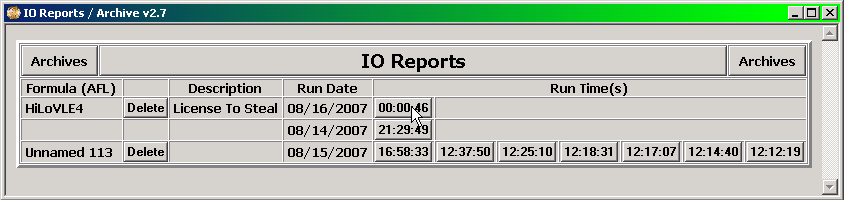
When an individual button relating to an IO run for an AFL for a specific run date and time is clicked then the summary for that run will appear.
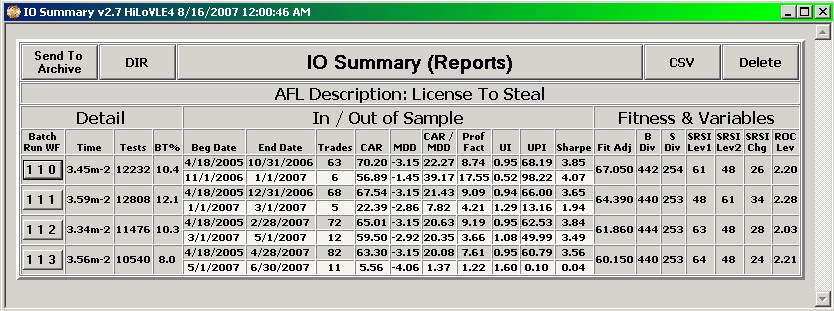
This typically shows the amount of time the run took and the number of tests performed along with whatever performance metrics the user desires as well as the parameter values of the best solution from optimization. If Out Of Sample testing was performed then there will an additional line of performance metrics for the out of sample period. If Walk Forward testing was performed then there will be multiple groups of the above information i.e. one for each Walk Forward segment. Clicking on a button for a particular segment brings up a detail screen which shows the chart as of the end of that particular segment, the trade list for the in and out of sample period it covers and the result of final sensitivity testing.
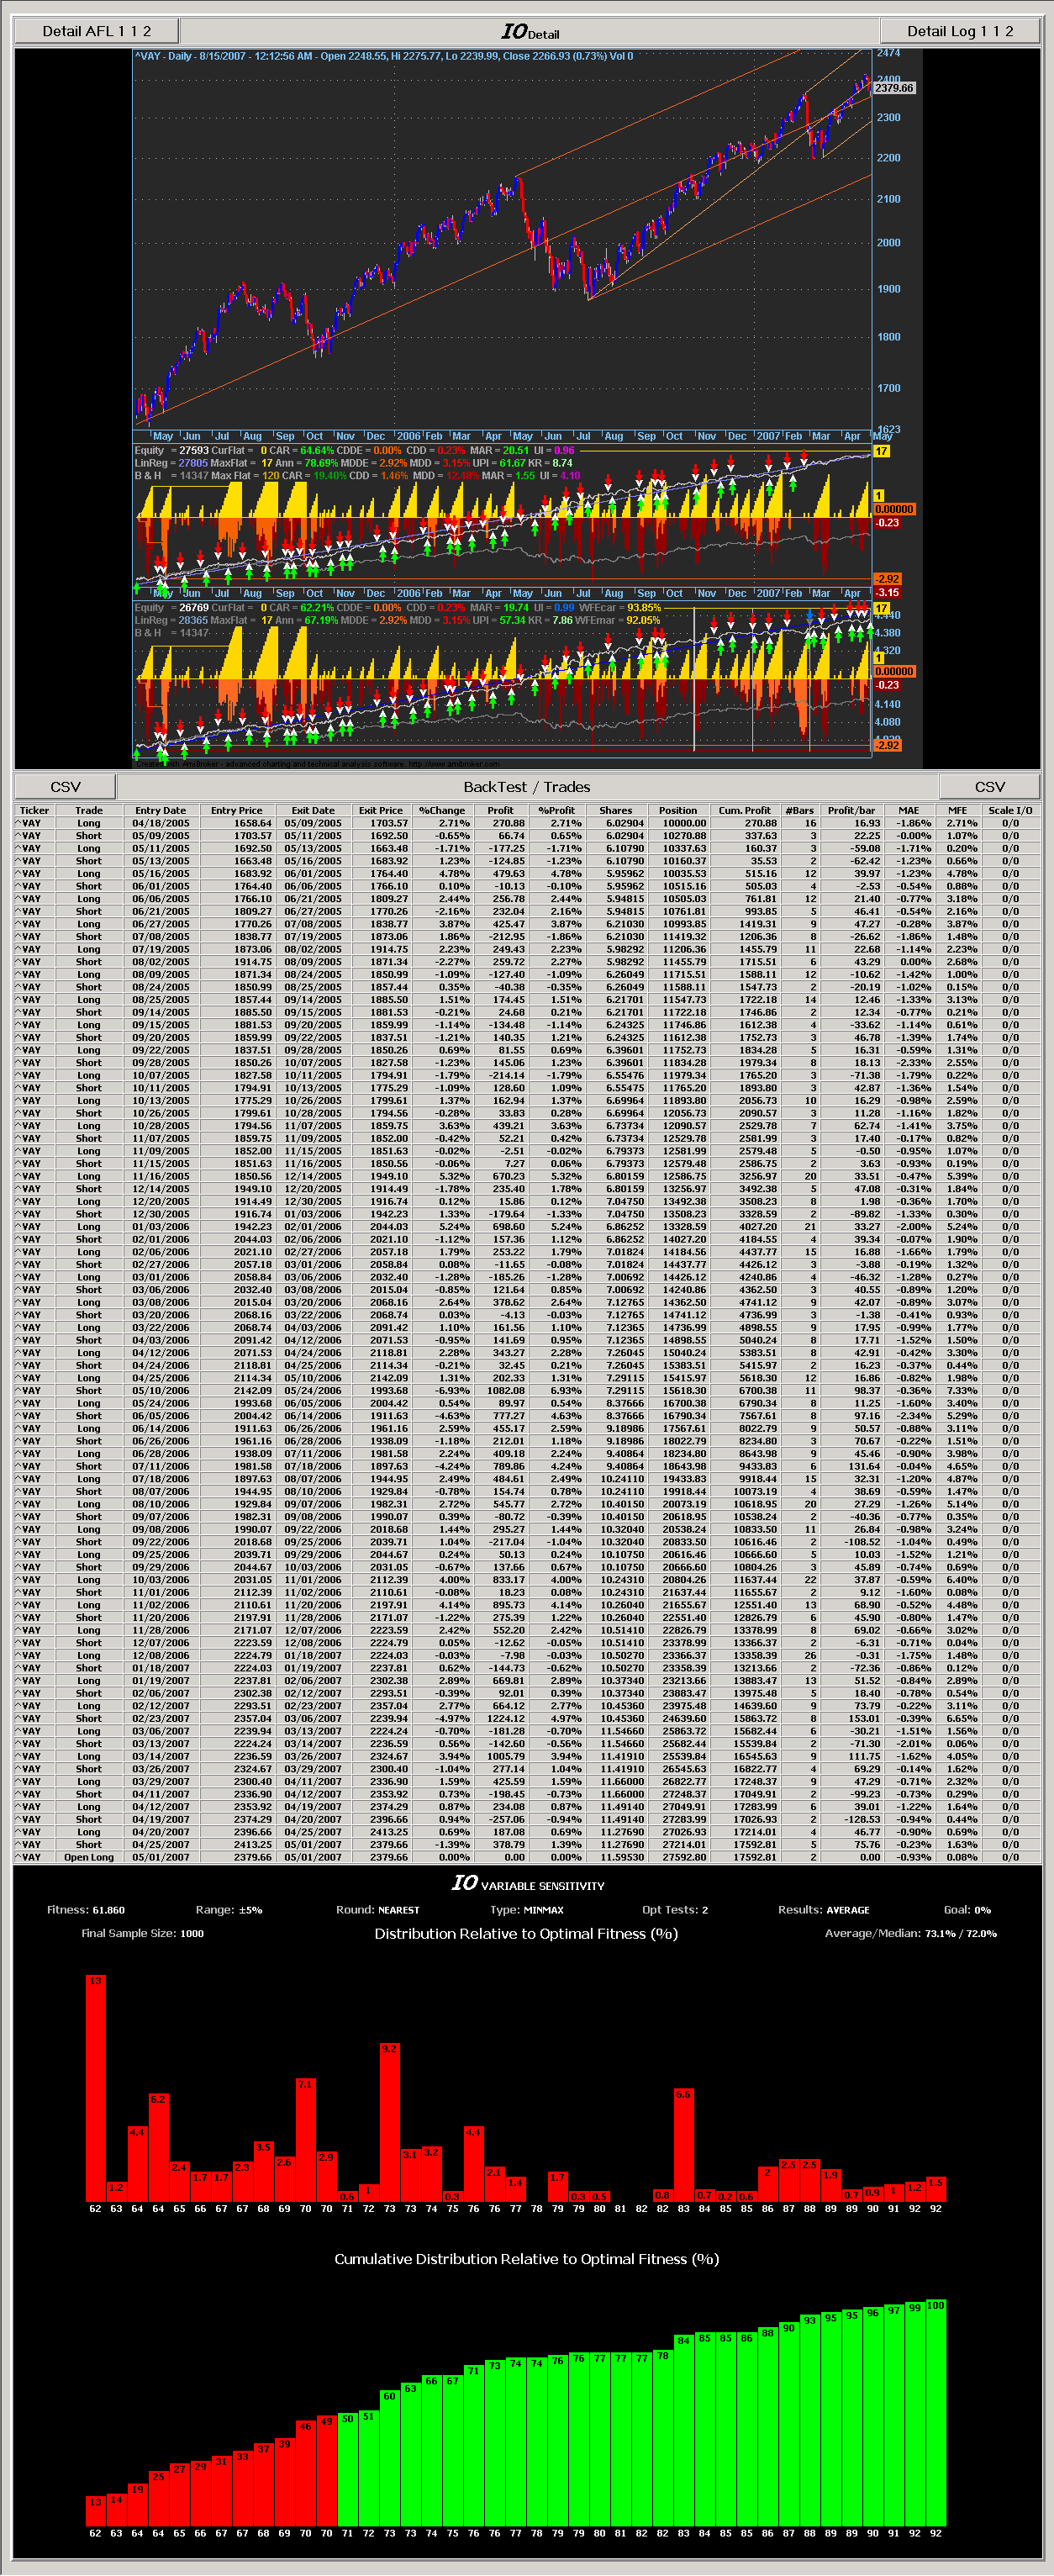
The Detail Screen has buttons to:
– Open a CSV file of the Trades, assumedly in Excel, for further manipulation if desired
– Show the AFL in play with the parameter values from optimization put into the default values of the optimization statements
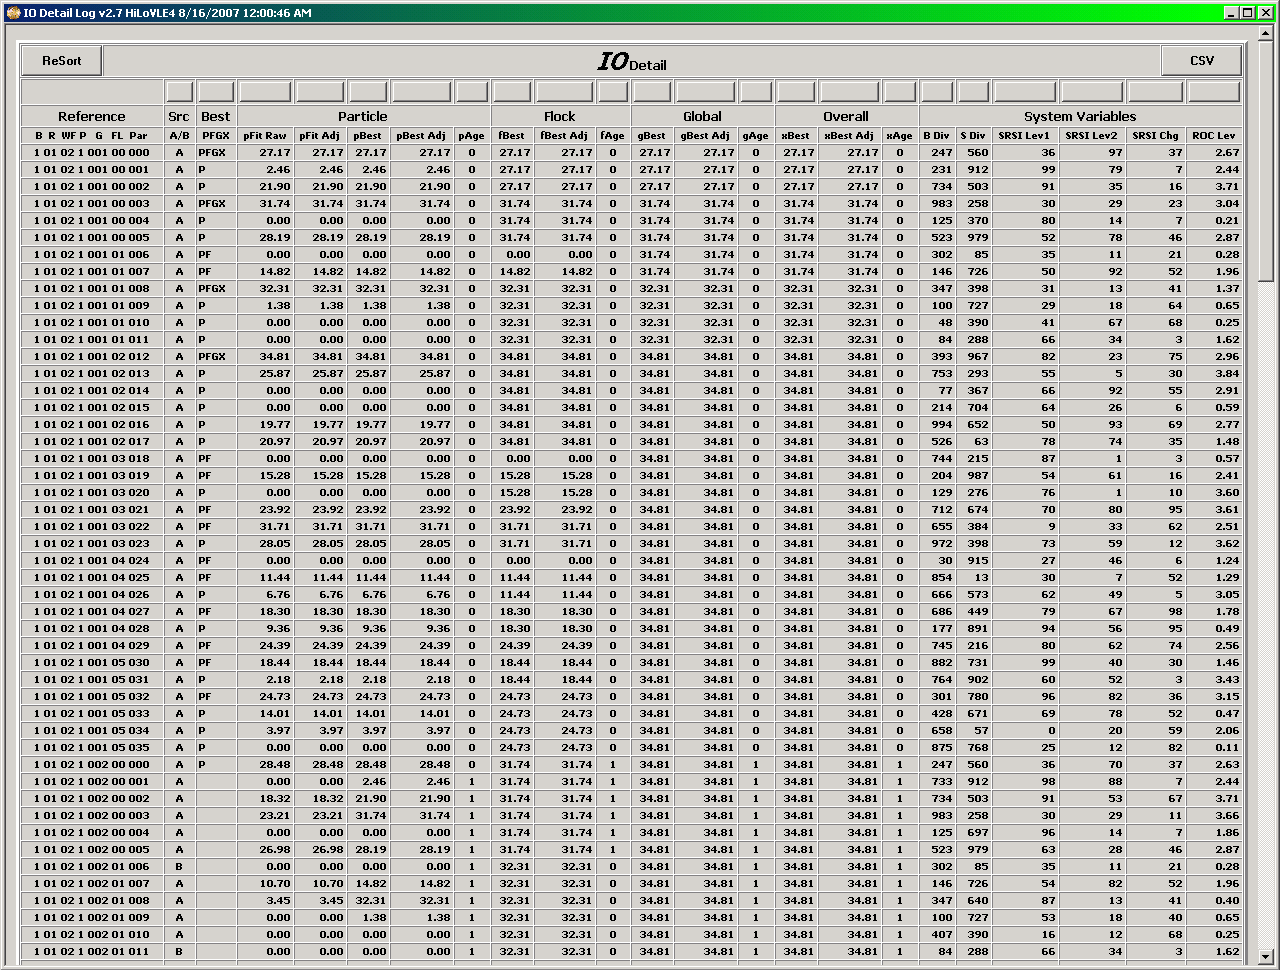
– Show the Detail Log if requested by IO Directive which will show the results of every test performed during optimization and can be sorted in any order desired.
A shareware version of IO with full documentation can be found in the AmiBroker Files Section …
http://groups.yahoo.com/group/amibroker/files/IO.zip
http://www.amibroker.org/userkb/wp-content/uploads/2007/08/io-reports.png
Filed by Fred at 11:11 pm under Intelligent Optimization
Comments Off on IO – Ease of Use
DRAFT
OBJECTIVE
The objective of this tutorial is to demonstrate how to use Microsoft Paint to capture screen images suitable for insertion into Users’ Knowledge Base (UKB) posts.
INTRODUCTION
Paint is a simple drawing and image editing tool that is generic to all versions of Microsoft Windows. It can be used to capture, and edit, screen images for use in UKB posts. The program can be opened from the operating system Start > All Programs > Accessories path. The program is limited in features but ‘professional’ level publishing skills are not essential for publishing to the UKB. Content is considered more important than the format! It is recommended for occasional authors, especially if a post only contains a few images, or for those who prefer not to have to buy screen capture software.
For additional information on Paint refer to: Paint (Software) from Wikipedia
Paint supports BMP, GIF, TIFF and PNG file-types. For a comparison of the suitability of each type, for web publishing, refer to: GIFF, JPEG or PNG
SPECIFICATIONS
This tutorial was written using Microsoft XPHome, Word 2002 and Paint V5.1.
CAPTURING IMAGES
Preparation
When Paint is opened the canvas (the white square in the Editing Window) will be the size of the last image that was used before the program was closed. The canvas needs to be smaller than the image pasted into the Editing Window or the image, when saved, will include the excess white space. As a time saver the default canvas size can be reset before each session.
Note: a small canvas will auto-size to a larger image but not vice-versa.
To set the canvas size:
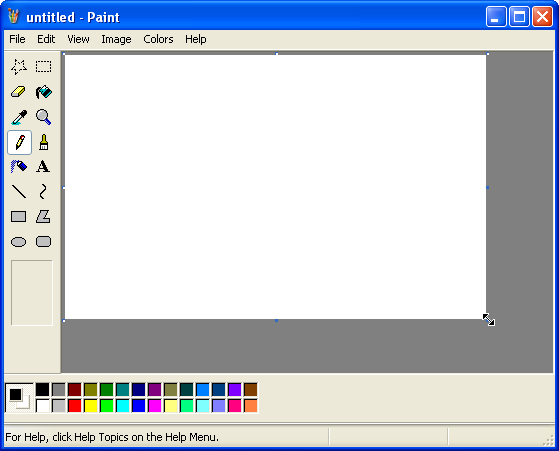
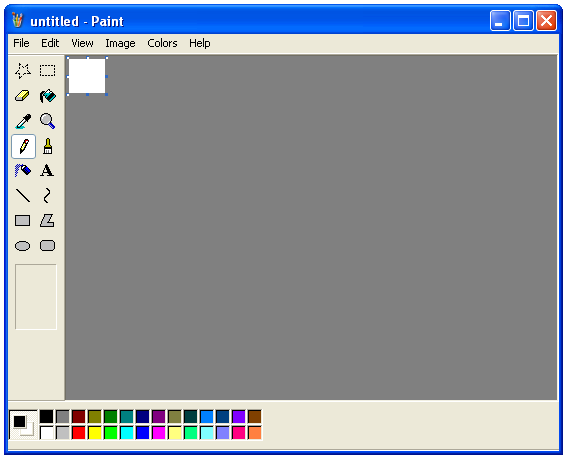
1) Open Paint and hover the mouse pointer over the bottom right corner of the canvas until a moving pointer appears.
Figure 1
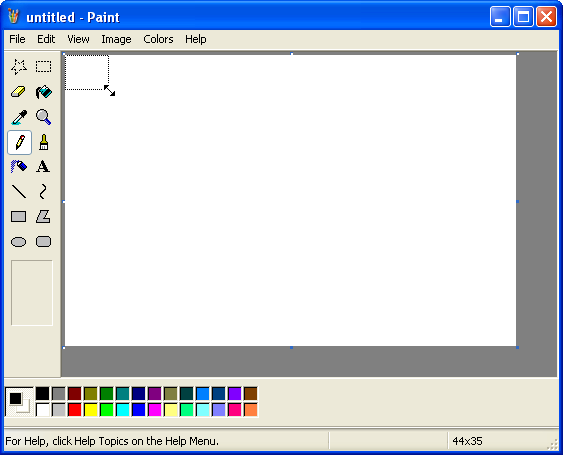
2) Hold down the left mouse button and drag the moving pointer to resize the canvas to a very small area.
Figure 2
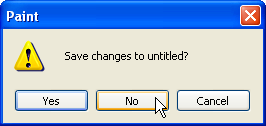
3) Close paint and click on No when asked to Save changes to untitled?
Figure 3

4) Open Paint again and the canvas will now be small (this will also be the default size for new canvasses for the session).
Sizing screen-shots:
Once an image is captured it will lose clarity if it is resized. Since the images are going to be inserted into a standard web-page, minus the width of the sidebar, (the width at the top of a UKB page is approximately equivalent to a letter size document in a word processor) it is better to keep them to less than around 6 inches, or 600 pixels (authors will need to experiment with this as pixelation varies from machine to machine). This rules out any chance of using clear full-size screen-shots in a standard post. One way to get around this is to alter the story line to avoid having to use full screen-shots. Another is to minimize and/or resize the window when taking large screen shots.
Note: this alters the proportion of the contents of the window so using this method is always a compromise between clarity and a faithful reproduction of what the user will see on their screen when they follow the instructions.
At other times, there is just no way around it and the show must go on, ‘grainy’ image or not. However, since the details contained in an image are often critical to UKB posts, full screen shots can be attached without resizing, provided they are not included in the first page (images that are larger than the available space will run off the page and overwrite the UKB sidebar if they are inserted at the top of the post). This makes for very large images, which will not view correctly in all web modes, but readers can easily find ways to view the full image and see the detail.
Note: As a UKB ‘page’ is scrolled downwards, the sidebar moves off the screen and the width available for publishing increases, so larger images can be inserted into a post after the first page. This is not the case for all web views e.g. when reading RSS feeds in I.E. v7 the sidebar is a permanent fixture, and it does not scroll off the page, which makes for a different page width in the reader compared to the ‘online’ view (in this case, images are trimmed, from the right, to fit into the available space.
A handy trick for sizing the images before capture is to open them in a second window, over the top of a Word document in Print Layout, and use the ruler in Word to align the image to the width of the document ( as a rule of thumb the image needs to be able to fit into a Word page without resizing).
To estimate image size:
Figure 4
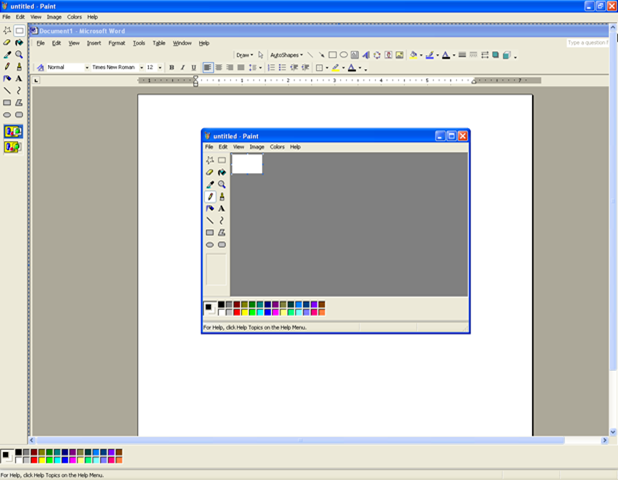
Note: This image is ‘grainy’ because it has been resized from 1280 x 944 pixels to 618 x 480 pixels to fit onto the ‘page’.
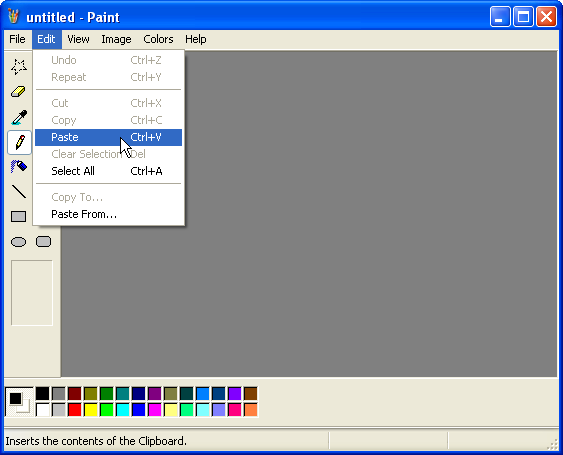
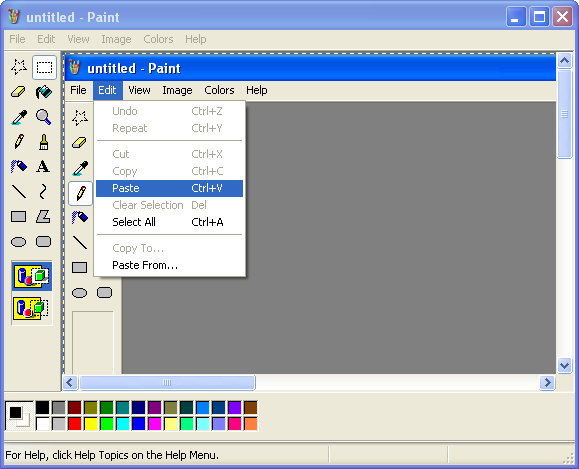
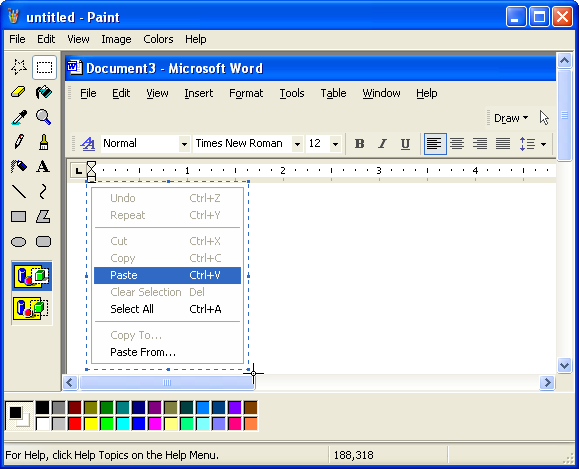
5) When the image has been correctly sized, press and hold down Alt then press the PrintScreen key on the keyboard (a copy of the current, or topmost, window will be placed on the Clipboard).
Note: a screen-shot can be taken by pressing PrintScreen alone.
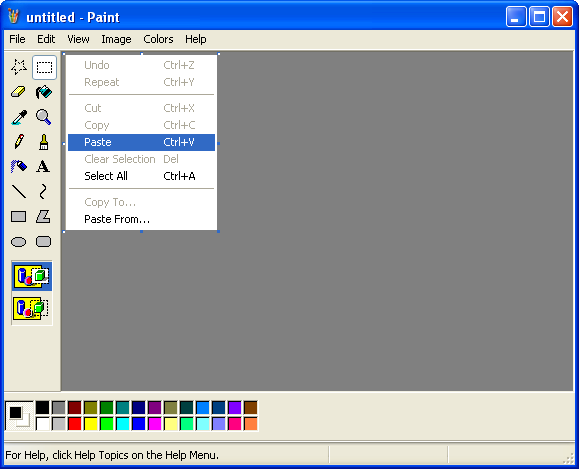
The captured image can be pasted into Paint by selecting Edit > Paste from the menu bar and then saved to the local disc for later use.
Figure 5
Note: The captured image can also be pasted from the Clipboard straight into Word, or an editor (depending on the program used) if image editing is not required, or a backup is not going to be kept.
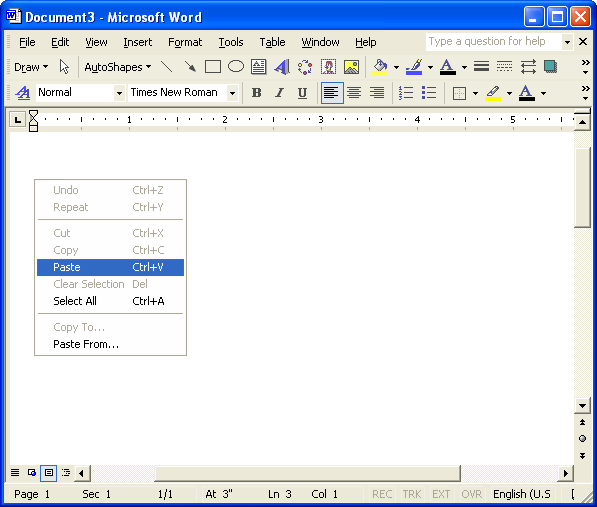
As work progresses, the underlying Word view, and the window to be captured, can be toggled back to the ‘top’ by clicking on the Word icon in the desktop Taskbar, followed by the program icon.
Figure 6

EDITING IMAGES
Paint can be used for basic image editing.
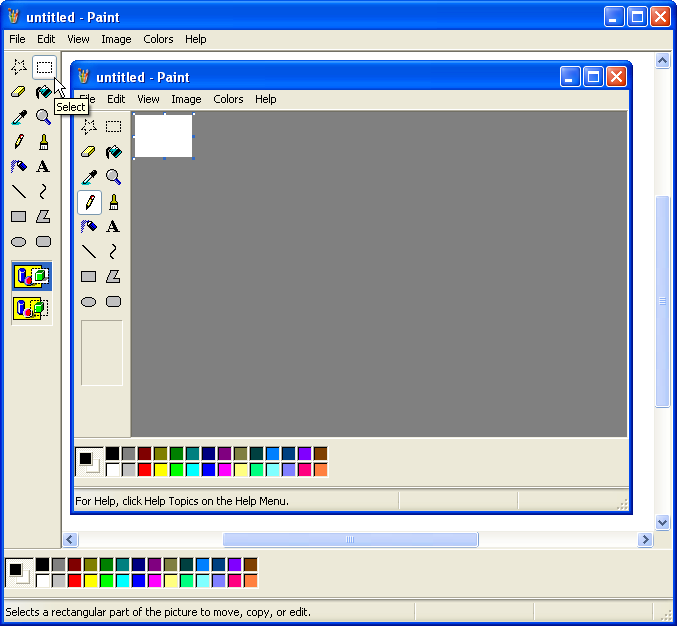
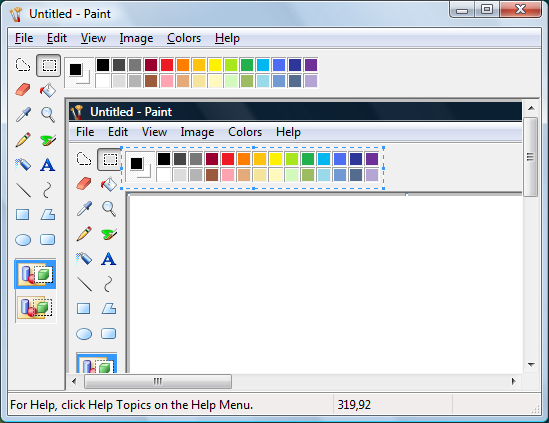
Using the select tool
Any section of a screen-shot can be cut from the image, using the Select tool. As an example, the Paint window, in Figure 4 above, will be isolated from the screen-shot and saved for insertion into a post.
To copy and save a window contained in an image:
Note: This is a nominal exercise to demonstrate some core procedures. In practice, a window can be copied by using Alt > PrtScn.
Figure 7
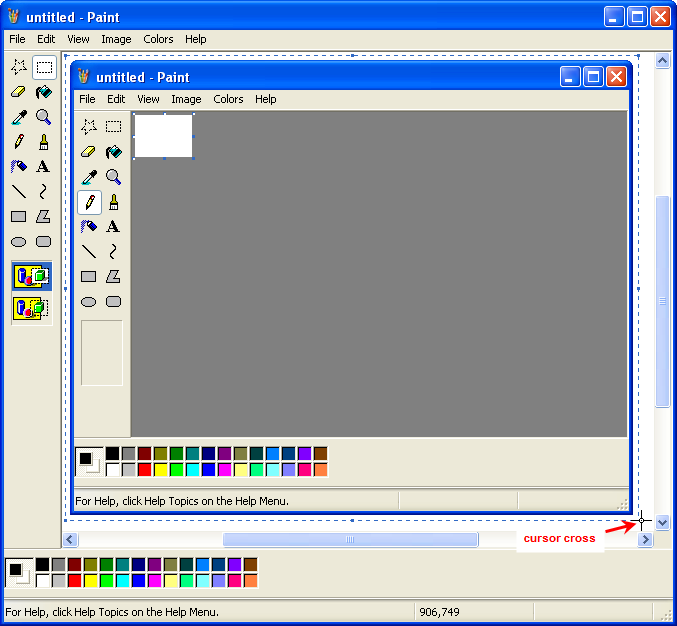
2) Position the select tool cursor cross over the top left hand corner of the required area and drag the cursor to surround it with the ‘cut-out’ marker.
Figure 8
Note: It is difficult to position the ‘cut-out’ markers precisely over the image, and copy it, without some over-cut on the edges. A good trick is to drag the window over top of a blank Word document before taking the screen-shot, as the background to the ‘cut-out’ will be white. If the background is white, there is no need to be precise with the ‘cut-out’ shape as the white over-cut will blend into the post background.
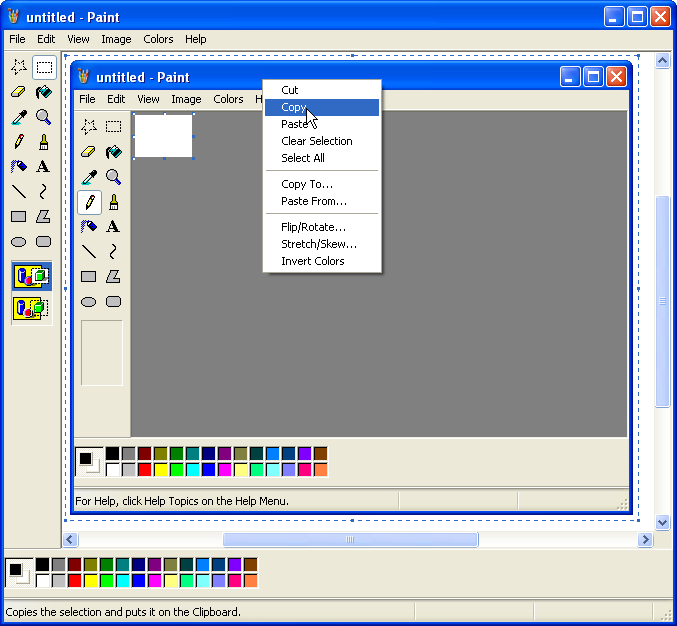
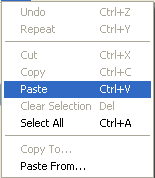
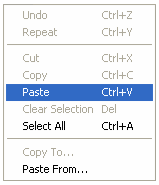
3) Right click inside the marked area and select Copy from the context menu that opens.
Figure 9
4) Select File > New from the menu-bar to open a new canvas.
Figure 10
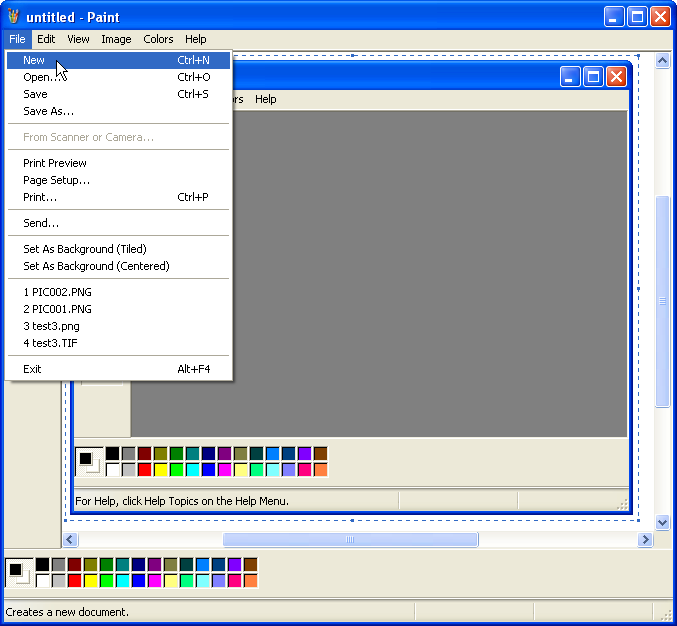
5) Click on No when asked to Save changes to untitled? ( a new Editing Window will open).
Figure 11
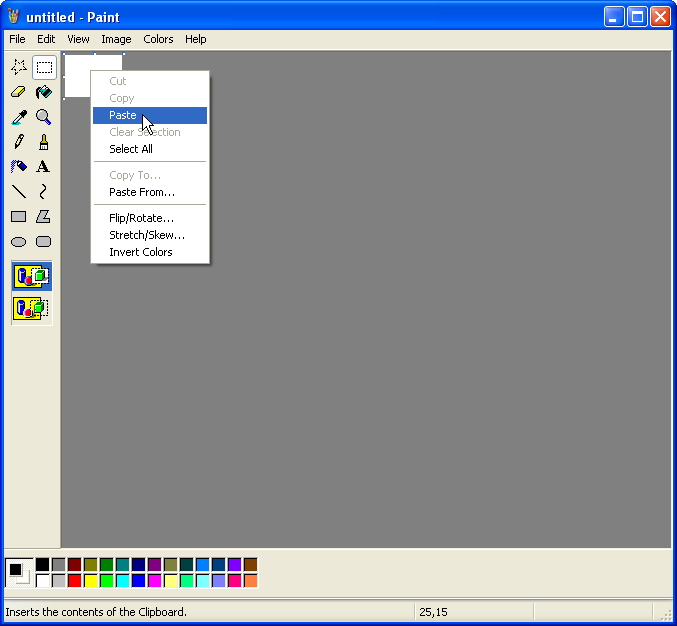
6) Right click inside the blank canvas and pick Paste from the context menu (the copy of the cut-out area will be pasted onto the blank canvas).
Figure 12
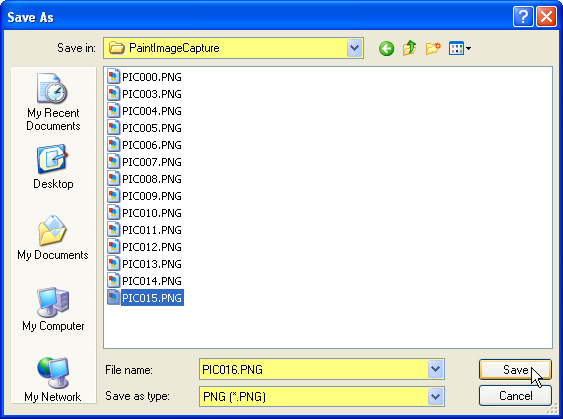
7) Go to Save As from the File menu to save the copied image (the Save As browser window will open).
Figure 13
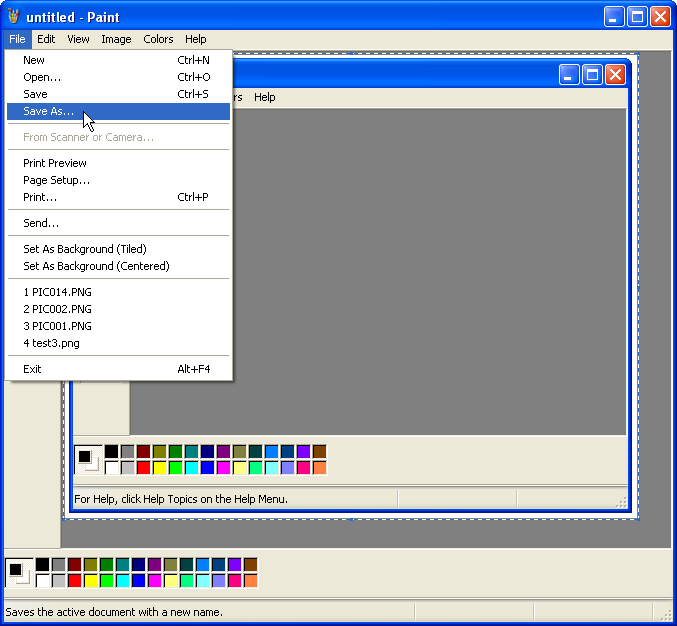
8) Select the folder to Save in and the Save as type, enter a title into File name and click on Save.
Figure 15
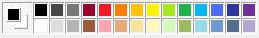
After the image has been saved it can be inserted into a post e.g. the image below is the window that was ‘cut-out’ and saved as a copy in the example above. Notice that when an image, with white over-cut edges, is inserted into a post the white cant be seen.
Figure 16
Note: Once again, if the image is not going to be backed up the copy of the cut-out can be pasted into an editor and Paint, or the current window, can be closed without saving.
The Select tool can also be used to ‘clip’ any part of a window e.g. toolbars, menus etc. This is a more difficult exercise, than copying a complete window, since in most cases the objects in question will be surrounded by a variety of shapes and colors so the captured images need to be trimmed with precision.
To copy a specific section of a window:
1) Capture a full-size screen-shot and paste it into Paint (if the required area of the screen is less than 6 inches sizing is not an issue).
Figure 17
2) Use the Select tool to position the cut-out marker as close as possible to the edge of the required section.
Note: If the background color of the cut-out is white it will not view well online, where the background is also white, without a border. There are two ways to work around this. Either err on the side of over-cutting to ensure that the borders, if any, are captured, or under-cut the image and add borders to it in Word. If the background color of the cut-out is not white, err on the side of undercutting as borders are not essential for colored images.
Figure 18
3) Copy and paste the cut-out onto a new canvas and save it to disc or, alternatively, paste it into an editor.
Figure 19
Clipping screen-shots, using Paint, doesn’t produce images with the precision of specialist screen capture software but the quality is still reasonable.
Figure 20
Some minor editing glitches, like the over-cut borders in Figure 20, can be worked around using a combination of Word and Paint.
Cropping images in Word
Images, cut from Paint, can be trimmed in Word.
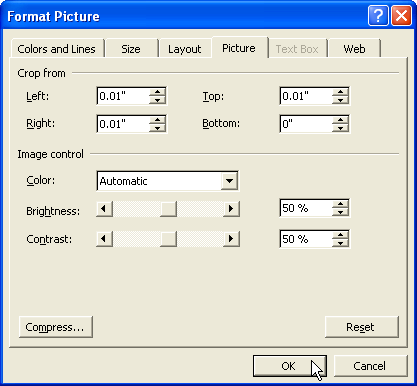
To crop the edges of an image:
Note: the default when scrolling is 0.01 inches. Finer cropping can be achieved by typing into the input boxes and using two decimal places (the settings shown in Figure 21 were used, in this example, to clean-up Figure 20).
Figure 21
The nominated amount will be cropped off each side of the image.
Figure 22
Note: Trial and error is sometimes needed to achieve the desired result. If necessary use Edit > Undo from the menu-bar to restore the image and repeat the exercise using different settings.
4) When a satisfactory outcome has been achieved, capture a screen-shot of the Word doc that contains the edited image and paste it into Paint for editing.
Note: The original version, held in Paint until a successful edit has been completed, can be dumped at this stage.
Figure 23
Note: the image can be over-cut because it now has a white background.
Although there is some loss of quality, due to the number of times the image has been copied between mediums, it still does the job.
Figure 24
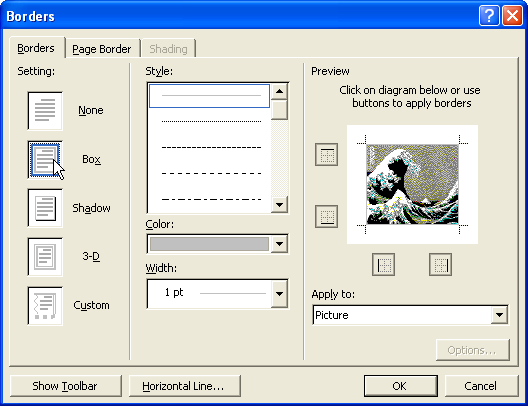
Adding borders to images in Word
Borders can also be added to images that are edited in Word
To add borders to an image:
Figure 25
6) Use Paint to capture, cut-out and save the image.
EXAMPLE
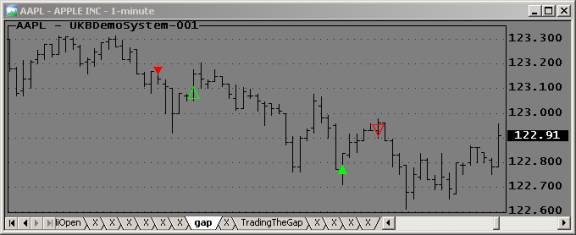
Figures 26 – 28 are examples of capturing an AmiBroker chart image by:
1) Sizing the program over Word.
Note: in this example the window was over-sized relative to the Word page because it is the chart that the window contains that is of interest.
Figure 26
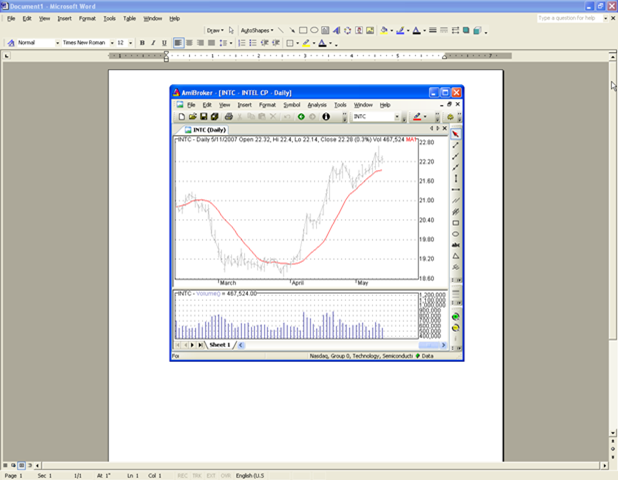
Figure 27
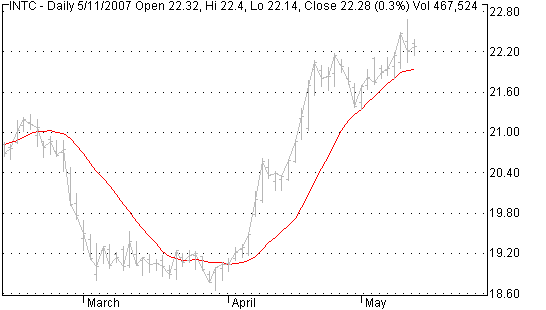
Figure 28
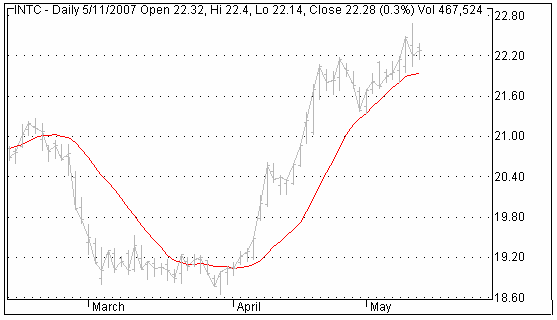
The final image isn’t too bad at all!
Additional editing features
Text and arrows etc can be added to images to clarify and highlight features.
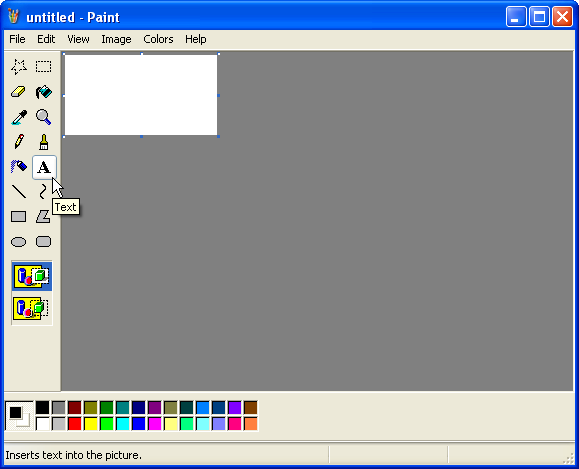
To add a text box to a figure:
1) Click on the Text icon in the Toolbox.
Figure 29
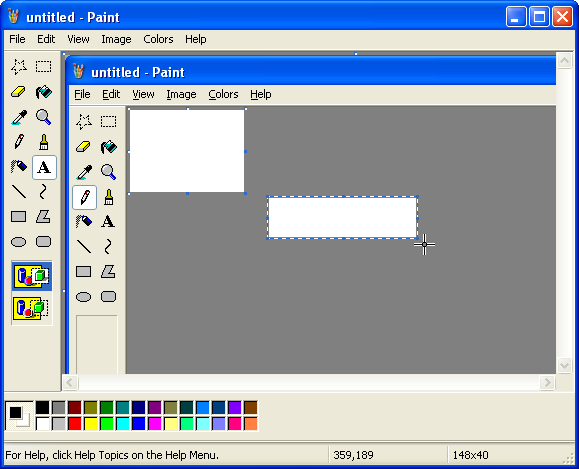
2) Position the cursor cross in the image, where the text is going to be inserted, and hold down the left mouse button while dragging it to form a box of the required shape and size.
Figure 30
3) Type text into the box.
Figure 31

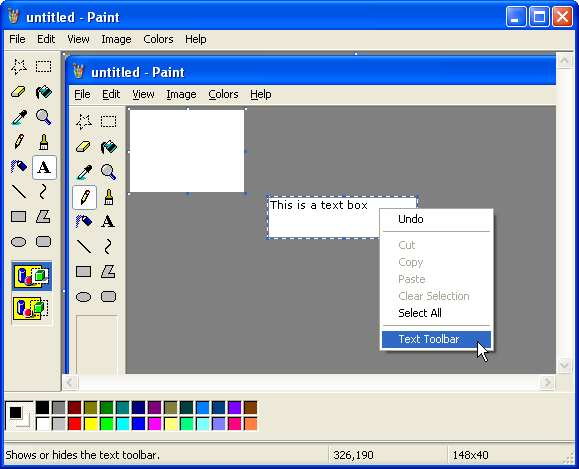
4) Right click inside the text box and pick Text Toolbar from the context menu that opens.
Figure 32
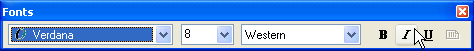
5) Text in the box can be formatted using the floating toolbar that opens.
Figure 33
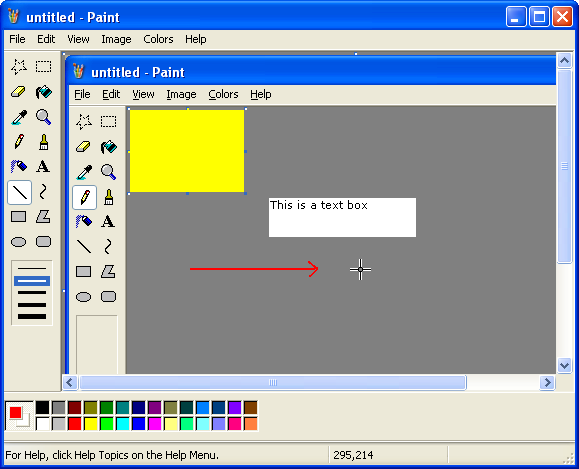
Additional editing tools e.g. eraser, pencil, paintbrush etc can be used in a similar way.
Figure 34
For additional information on image editing refer to the Paint help manual.
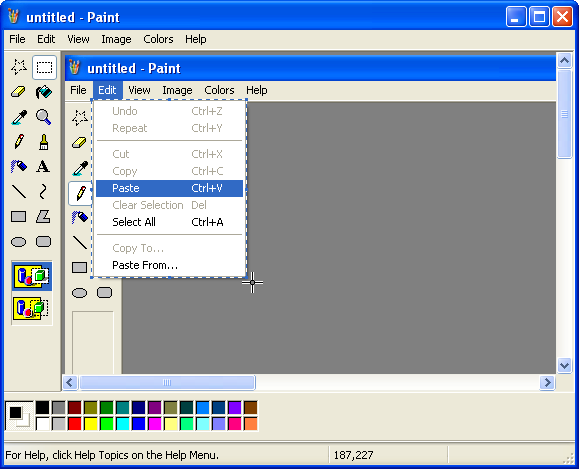
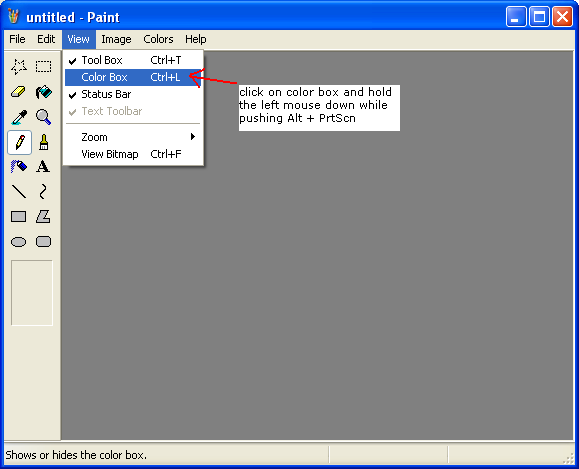
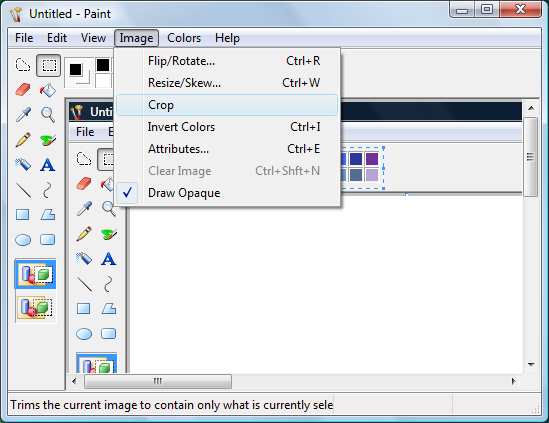
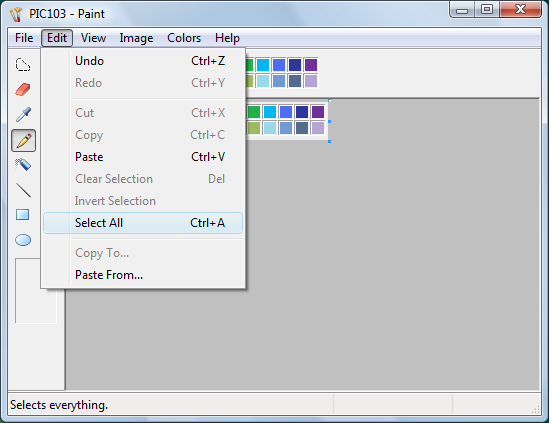
Capturing menu bar dropdowns
Some examples need the menu bar dropdown to be visible in the window. If Alt + PctSrn is used the dropdown will close as soon as Alt is pushed. One way around this is to position the mouse pointer over the menu (or a command in the menu) and hold the left mouse button down while pushing Alt + PrtScn at the same time (Figure 35 was ‘taken’ use this method).
Figure 35
VISTA VERSION
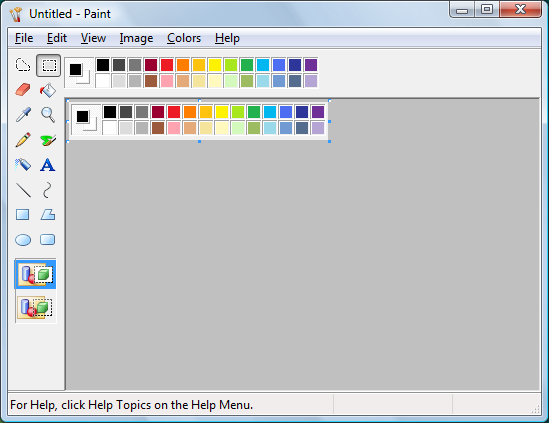
A new version of Paint, V6, has been included with the release of Vista, Microsoft’s new operating system. The features in V6 are almost identical to the previous version, except for the addition of image cropping.
To crop images in Vista’s Paint:
1) Use the Select tool to mark the cut-out area.
Figure 31
2) Select Crop from the Image menu box.
The area outside the marked section will be cropped from the picture.
3) Save the image to the local disc for future use or copy paste in straight into an editor.
Note: The crop feature can not trim the edges of images. Images with colored over-cut on the edges will still need to be pasted into Word for trimming.
To copy an image from Paint for pasting to Word, or an editor:
A copy of the image will be placed on the clipboard for pasting into another program in the normal way.
Filed by brian_z at 1:09 am under Contributors
Comments Off on Capturing Images Using Microsoft Paint (v3)
This system was intended to provide signals to demo trade automation. However, its signals are not that frequent and it proved to be quite boring to automate it. The code is left here but I plan to use another system to demo trade automation. You may also note that I separated Real-Time System Design from System Automation. This was done to allow categories to evolve independent from each other.
To develop trade-automation code we need a demo system to generate signals and to test TWS interfacing. To be able to continue this series and not waste time looking for a superb system, I’ll use the following very simple trading rules:
Buy at the Open of the current bar if it falls below the previous Low.
Sell at the Close when the current Low falls below the previous Low.
Short at the Open when the Open exceeds the previous High.
Cover at the Close when the current High exceeds the previous High.
In AFL this looks like this:
SetOption("CommissionMode",3); SetOption("CommissionAmount", 0.005); SetTradeDelays(0,0,0,0); Buy = O < Ref(L,-1); BuyPrice = O;<br>Sell = L < Ref(L,-1); SellPrice = C;<br>Short = O > Ref(H,-1); ShortPrice = O;<br>Cover = H > Ref(H,-1); CoverPrice = C; E=Equity(1);<br>Plot(C,"",1,128); if( PlotTriangles = ParamToggle("Triangles","HIDE|SHOW",1) ) { PlotShapes(IIf(Buy, shapeSmallUpTriangle, shapeNone),5,0,BuyPrice,0); PlotShapes(IIf(Sell, shapeHollowDownTriangle, shapeNone),4,0,SellPrice,0); PlotShapes(IIf(Cover, shapeHollowUpTriangle, shapeNone),5,0,CoverPrice,0); PlotShapes(IIf(Short, shapeSmallDownTriangle, shapeNone),4,0,ShortPrice,0); }
The above code is a variation of The Full Gap-Trading system. You can read more about this type of system on the Stockcharts site and many other Internet sites.
This system will produce trades in all timeframes, trade frequently, and trade both long and short. Running this system in the 1-15 minute timeframe will give us lots of action and make it easier to develop and debug the Trade-Automation (TA) code. An AT trading system designed around a system that gives only a few signals a day will take forever to debug. Mechanical performance is the first objective.
For now we assume that we can enter at the bar’s Open price. Note that I exit at the Close of the bar because, in the AmiBroker database, this is the next price that is available. At this stage this system is designed to stimulate trade-automation code and not to make you rich; DO NOT TRADE IT. Order types and/or strategies will be decided on later. Trade-Delays are set to zero because they are better handled in the code. The Equity(1) statement is used to remove redundant signals. The indicator should display trades as follows:
Edited by Al Venosa.
Filed by Herman at 5:00 pm under Real-Time System Design
Comments Off on Real-Time Gap-Trading Demo, Basics (v3)
TO BE COMPLETED AT A FUTURE DATE.
In the short term here’s the patch!
The published date, for a post, is listed in several places. It is used for everything by default – searches, post order, RSS feedstream etc. AmiBroker customized a Page Order property to allow Table Of Contents sorting. It is mainly used where an Author is writing a ‘series’ of posts on a specialist topic e.g. I/O, Automated Trading. The Author is ‘assigned’ ownership of the category so they can present their posts so that visitors read them ‘like a book’.
Page Order can be set from the WordPress Admin Center. Go to Manage and open the relevant post(s). Change the Page Order setting from the default (zero) to any whole integer between – 2,147,483,648 and + 2,147,483,648 to position the post in order, relevant to other posts in the category or sub-category (1,2,3,4,5, etc is as good as anything since it aligns to the default bulleted numbers assigned to the TOC view).
1) Change the sort number in the Page Order properties box.
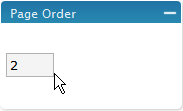
Note: This is the Page Order setting for Contributors >> UKB Post Formats, which makes it the second post in the Contributors category.
2) Save the post to lock in the changes
Note: There’s no need to worry about editor conflict. Any post property can be reset without conflict, irrespective of what editor was used to publish the post (posts that are written in WLW can have the Page Order reset from the WP Admin Center without problems)
Posts can also be reordered by ‘manually’ changing the published date but!!!!!!
note: changing publish date will change the folder that the post is stored in – if it moves the post to a new month ??? – server folders are on a (monthly) date basis -(will affect links to it that exist in other posts)
need to address the issue of reporting broken links.
Filed by brian_z at 7:27 am under Using WordPress
Comments Off on Ordering Posts
Filed by brian_z at 5:54 am under Contributors
Comments Off on UKB Post Formats (v2)