How Do I Read RSS Feeds?

TO BE DELETED – CONTENT WILL BE COMBINED WITH ‘USING AMIBROKER RSS FEEDS WITH INTERNET EXPLORER


For those subscribed, the Users? Knowledge Base Feed will be listed in the Internet Explorer Favorites Center, under Feeds.

ReadRSS1

The number of posts saved, the frequency of updates, and other options, can be set from the Feed Properties window. To open the Properties window, right click on the Users? Knowledge Base link in the Feed list and select Properties from the context menu that opens, or, click on the View feed properties link in the browser window RSS page.

ReadRSS2

If the posts are in a summarised form the text will end with the word (more….) as a link. The full version can be viewed by clicking on the link, or, by clicking on the right arrow at the top of the post.

ReadRSS3

The full version of the post will open with the comments below. Scroll down to read the comments, if any.

ReadRSS4

Comments can be viewed separately, in a scrollable list, by subscribing to the Users? Knowledge Base Comments RSS.

To unsubscribe from a feed service, simply right click on the link in the Favorites Center and delete the link.

Introduction To RSS

DRAFT – SUBJECT TO SUBSTANTIAL REVISION

RSS Feeds, also known as XML feeds, syndicated content, or web feeds, are a means to automatically obtain frequently updated content published by an RSS enabled website. They are most often used for news and blog websites, but they can also distribute other types of digital content, including rich media (pictures, audio files, or video). Popular Internet Browsers like Internet Explorer, FireFox and Safari can discover and display feeds as you visit websites. You can also subscribe to feeds to enable automatic checking and downloading of updates that you can view later. Account holders at the major Internet Portals, like Yahoo and Google, can also access RSS content using inbuilt readers from within their personal pages. Stand alone feed-reading, or news-aggregator software, is also readily available for providing users with access to enhanced features:

  • audio or visual announcement of new posts,
  • watch or search for keywords automatically,
  • save individual articles manually,
  • integrate items from multiple feeds and organize by subject,
  • offline reading,
  • play rich media content,
  • view headlines, summaries or full articles,
  • and more.

Content summarized from Internet Explorer help files and other internet sources. Reference Internet Explorer > Help for the complete transcript.


RESOURCE LINKS

1) Link to a free site that forwards RSS Feeds to an email address: http://www.rssfwd.com/

Example Database

Easy access to free Yahoo data, using AmiBrokers companion down-loader AmiQuote, is a huge bonus for AmiBroker users.

In this tutorial, the first in a series of Users’ Knowledge Base articles on Yahoo data management, new users are introduced to some basic concepts utilizing mainly GUI methods. Walk through examples, using the Dow Jones Industrial Average database installed with AmiBroker, and apply simple customized formulas written in AFL (AmiBroker Formula Language).

FORMULAS FEATURED: BeginValue(); LastValue; DateNum(); BarCount; Status(); FullName(); IsIndex(); GroupID(); MarketID(); SectorID() and IndustryID().

INCLUDING: database location, backup and naming; ticker lists (.tls files); company information pages; symbol addition and deletion; updating quotes; writing and saving formulas in Formula Editor; running Explorations and viewing the results list; data quality checking using the Database Purify Tool; adding favorites to the Web Research list; setting the default and scrolling Yahoo pages in the AmiBroker browser; deleting quotes in Quote Editor; rearranging the Workspace layout using the Docking sticker; Ticker Toolbar searching and more …………….

Attached Files:

  • exampledatabase.doc (1178 KB) (Word 2002 document)
  • x-categories.afl (262 bytes)
  • x-database.afl (226 bytes)
  • Click on the link to browse document files on line, or, Save As to download an editable version, complete with a document map (the document map will only be available to users who own a copy of Word).
  • To download .afl files to the desktop right click on the link  and Save Target As ‘filename’ at Program Files/AmiBroker/Formulas/Custom to access them as formulas in the AmiBroker Charts list.

Time Calculations

Time calculations are needed when placing GAT (Good At Time) and GTD (Good Till Date) orders. The simplest way is to convert the TimeNum to a SecondNum, perform your calculations in Seconds, and then convert the SecondNum back to a TimeNum. The first two functions below will do that for you.

The next function applies a reference expressed in seconds to your Reference time. This reference would typically be used to Calculate GAT times. You may need this function when you want to apply an offset to a Time Reference and have orders activated automatically during the day without having to be online.

function TimeNumToSecondNumTimeNumber )
{
Seconds int(TimeNumber%100);
Minutes int(TimeNumber/100%100);
Hours int(TimeNumber/10000%100);
NumberSecs int(3600*Hours+60*Minutes+Seconds);
return NumberSecs;
function SecondNumToTimeNumSecondNum )
{
Hours int(SecondNum /3600);
Minutes int((SecondNum -Hours*3600)/60);
Seconds int((SecondNum -Hours*3600)-Minutes*60);
TimeNumber Hours*10000 Minutes*100 Seconds;
return TimeNumber;
}
function ApplyOffsetToTimeNumRefTimeNumberOffset )
{
OffsetSecondNum TimeNumToSecondNumRefTimeNumber ) + Offset;
OffsetTimeNumber SecondNumToTimeNumOffsetSecondNum );
return OffsetTimeNumber;
}
OffSet Param("Offset in Seconds",0,-100,100,1);
RefTimeNum ParamTime("ReferenceTime",Now(2));
CalcTimeNum ApplyOffsetToTimeNumRefTimeNumOffset );
Title ="\n"+
" Reference Time: "+StrRight(NumToStr(DateTimeConvert2DateNum(), RefTimeNum),formatDateTime),11)+"\n"+
"Calculated Time: "+StrRight(NumToStr(DateTimeConvert2DateNum(), CalcTimeNum ),formatDateTime),11)+"\n";

Edited by Al Venosa.

Date Calculations (v2)

In Real-Time trading, you may need to perform date calculations that are referenced to your computer date instead of to the DateNumber of your data. Instead of struggling with years, dates, and months, it is much easier to use a linear data system like Rata Die, which simply counts the number of days since December 31 of the year zero. To use the Rata Die method you only need two conversion functions to convert between the Rata Die to DateNumbers and vise versa. In this post the Rata Die system will be used to calculate NASDAQ non-trading days and to calculate the date of the previous trading day.

The conversion functions listed below were posted on the AmiBroker User list by Paul Ho (thanks Paul!) and will be used the perform the needed calculations in this post.

NASDAQ non-trading days are copied from the NASDAQ website, converted to DateNumbers, and entered into the code using a ParamStr() function so that they can be changed annually without digging in the code. Here is typical listing for 2007:

NASDAQ Holiday Trading Schedule
2007 Dates – Unless noted, the following dates are holidays on which The NASDAQ Stock Market is closed:
January 1 – New Year’s Day
January 15 – Martin Luther King Jr.’s Birthday
February 19 – Presidents’ Day
April 6 – Good Friday
May 28 – Memorial Day
July 4 – Independence Day
September 3 – Labor Day
November 22 – Thanksgiving Day
December 25 – Christmas Day

To find the previous trading date, the code starts by using the previous Rata Die date, and if that isn’t a trading date, it decrements the Rata Die number until a trading day is found. Selected variables are output to the Chart Title so that you can vary the date using the ParamDate() and see haw the conversions work..

function DateNumberToRataDie( DateNumber )
{
num = DateNumber/10000;
yyyy = int(num) + 1900;
num = frac(num) * 100;
mm = int(num);
dd = frac(num)*100;
yyyy = yyyy + int((mm-14)/12);
mm = IIf(mm < 3, mm+12, mm);
RataDieNum = round(dd + int((153*mm-457)/5) + 365*yyyy + int(yyyy/4) - int(yyyy/100) + int(yyyy/400) - 306);
return (RataDieNum);
}

function RataDieToDateNumber(RataDieNum)
{
z = RataDieNum + 306;
g = z - 0.25;
a = int(G/36524.25);
b = a - int(A/4);
yr = int((b + g)/365.25);
Cc = b + z - int(365.25 * yr);
mm = int((5 * Cc + 456)/153);
dd = Cc - int((153*mm-457)/5);
yr = IIf(mm > 12, yr + 1, yr);
mm = IIf(mm > 12, mm - 12, mm);
dn = (yr-1900)*10000+mm*100+dd;
return dn;
}

function NoTradingDay( RataDieNum )
{
global DN, NasdaqNTDN;
DN = RataDieToDateNumber(RataDieNum );
DnStr = NumToStr(DN,1.0,False);
DW = RataDieNum%7;
return DW == 0 OR DW == 6 OR StrFind( NasdaqNTDN, DNStr);
}

NasdaqNTDN = "1070101,1070115,1070219,1070406,1070528,1070704,1070903,1071122,1071225";
weekdays = "Sunday,Monday,Tuesday,Wednesday,Thursday,Friday,Saturday";
DN1 = ParamDate("Date","05/07/2007");
RD1 = DateNumberToRataDie(DN1);
DW1 = RD1%7;
RD2 = RD1-1;
DN2 = RataDieToDateNumber(RD2);
DW2 = RD2%7;
while( NoTradingDay( RD2 ) )
{
RD2--;
DN2 = RataDieToDateNumber(RD2);
DW2 = RD2%7;
}
Title = "\n"+
"CURRENT TRADING DAY:\n\n"+
" Date: "+NumToStr(DateTimeConvert( 2, DN1),formatDateTime)+" "+StrExtract(Weekdays,DW1)+"\n"+
" Day Number: "+NumToStr(DW1,1.0)+"\n"+
" Rata Die: "+NumToStr(RD1,1.0,False)+"\n"+
WriteIf(NoTradingDay( RD1 ),"This is Not a Trading Day","This is a Trading Day")+"\n\n\n"+
"PREVIOUS TRADING DAY:\n\n"+
" Prev TDay: "+NumToStr(DateTimeConvert( 2, DN2),formatDateTime)+" "+StrExtract(Weekdays,DW2)+"\n"+
" Day Number: "+NumToStr(RD2%7,1.0)+"\n"+
" Rata Die: "+NumToStr(RD2,1.0,False)+"\n"+
WriteIf(NoTradingDay( RD2 ),"This is Not a Trading Day", "This is a Trading Day");

Edited by Al Venosa

Bar-Scaling Tool

When testing short-term trading systems that respond to single-bar price changes it is very convenient to be able to manually change a bar’s price and force a signal. The small program listed below can be prefixed to your system’s code and will do this by magnifying the selected High, Low and Close price with respect to the Open price of the bar.

SetBarsRequired(100000,10000);
BI=BarIndex();
SB=LastValue(ValueWhen(BI==SelectedValue(BI),BI));
EnableScaling=ParamToggle("Bar Scaling","DISABLED|ENABLED");
ScalingFactor=Param("HLC Scaling Factor",1,0,5,0.01);
if(EnableScaling)
{
Hd=H[sb]-O[sb];
Ld=O[sb]-L[sb];
Cd=C[sb]-O[sb];
Hd=ScalingFactor*Hd;
Ld=ScalingFactor*Ld;
Cd=ScalingFactor*Cd;
H[sb]=O[sb]+Hd;
L[sb]=O[sb]-Ld;
C[sb]=O[sb]+Cd;
}
//Code to demonstrate bar scaling
Short=Cover=0;
Buy=Cross(High,Ref(H,-1));
Sell=Cross(Ref(L,-1),L);
BuyPrice=Ref(H,-1);
SellPrice=Ref(L,-1);
Plot(C,"",1,128);
PlotShapes(IIf(Buy,shapeUpTriangle,shapeNone),colorBrightGreen,0,BuyPrice,0);
PlotShapes(IIf(Sell,shapeDownTriangle,shapeNone),colorRed,0,SellPrice,0);

Edited by Al Venosa

Introduction to Real-Time AFL Programming

The AFL examples presented in this Category offer quick-start solutions to help get beginners on their way to Real-Time AFL programming. Topics will include measuring time, executing delays, collecting real-time data, scanning stocks, collecting order status, detecting errors, displaying system and portfolio status, etc. Most of the code may be related to fast automated trading, but much of it can also be used in other forms of trading.

They are not intended to replace or be a substitute for official AmiBroker documentation such as the AFL Reference, ReadMe files in your AmiBroker Folder, Knowledge Base, AFL Library, official Video Tutorials, and other Support material.

The objective is to create a resource of basic examples that introduce you to AFL programming techniques that you can easily modify to meet your personal needs. If you are a beginner or even if you are an ardent system developer, a well-organized resource like this can save you many hours of programming and make system development a lot more fun.

If you like to use Drag and Drop, you can create a #AFL Solutions folder (the “#” is added to force this folder to the top of your tree) in your C:\Program Files\AmiBroker\Formulas folder using the Windows Explorer. When you return to AmiBroker, you need to click View -> Refresh All to make the new folder visible. Inside the #AFL Solutions folder you can create sub folders to meet your specific requirements.

If you discover a useful AFL solution, you should copy it to the appropriate sub-folder of your #AFL Solutions folder. This will give you an impressive coding resource in just a few short weeks. A typical layout might look like this:

snag-0774.jpg


If you adopt standard-naming conventions for your variables, many of your code modules will work together without too many changes. Eventually you’ll be able to build trading systems in minutes instead of hours, simply by Dragging-and-Dropping code modules into an Indicator or perhaps by using the AFL Code Wizard.

Edited by Al Venosa.

Resetting Indicators

Smoothing Indicators like MA(), EMA(), T3(), DEMA(), etc. are intended to give you an average indication of price movements. They do this by filtering out high frequency changes in a particular price variable. The problem is that such indicators introduce time lag into the system. Indicator lag is most readily apparent when the overall price chart is relatively smooth (for example, when a simple MA() stays within the High-Low range), and suddenly the price shifts or gaps. When this happens, most smoothing indicators need many bars to overcome the influence of these gaps and re-position themselves back within the average price range of the bar.

Although all trading systems depend on lag to know that something has changed, the degree of lag needed by a system varies. Resettable indicators are most useful in systems that require a smoothing function that closely follows the price, i.e., one that exhibits a minimum of lag.

When a Resettable Indicator encounters a sudden larger-than-normal offset to the average price, it changes behavior and resets the Indicator to a calculated reference point. While there are other patterns or conditions (Signals, Stops, Targets, etc.) in which you might want to reset an Indicator, this discussion focuses on simple gaps that are defined by the AFL functions GapUp() and GapDown(). The techniques introduced here work equally well with EOD or RT data. Another application of the concept would be in RT trading where you might want to reset your Indicator at the start of each new day or trading session.

The reset idea is based on the fact that smoothing functions have a primary period and that the Indicator’s lag will be proportional to that period, i.e. longer periods increase lag and shorter periods decrease lag. Knowing that, we can reset an Indicator by simply setting its period to a lower value. Typically, resetting to a period of 1 works fine. After the reset bar, the period is increased with each passing bar until it has reached its original value.

Consider the EOD example shown below. White bars identify the Gaps that trigger a reset.

snag-0773.jpg

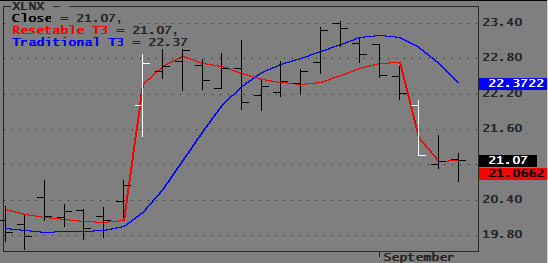
At the first White bar the price gaps up and the Traditional T3 (Blue) falls behind immediately and actually moves opposite to the price. The Resettable T3 (Red) reset itself when it detected the gap and almost immediately is able to track the price bars in the right direction.

There are many ways to reset an indicator: you can do it abruptly by setting the period to 1; you can maintain a minimum smoothing by resetting it to 2 or 3; or you can gradually adjust period and/or T3-Sensitivity according to some formula. The example code below uses the T3 formula that can be found in the AmiBroker library.

In the example below, I use the start (1st bar) of the trading day to reset the T3. However, there are many other situations where you might want to reset an indicator. For example, when using trailing stops or SAR type exits, sometimes you might want to reset an indicator when you get a Buy or Sell signal. You can assign your own reset reference by averaging all bar prices, e.g., (O+H+L+C)/4. However, you should stay away from averaged values as they would reintroduce lag. I prefer the use of (O+C)/2, but you should try any number of other ideas that fit your liking.

function T3( Price, T3Periods, s )
{
e1 = AMA( Price, 2 / (T3Periods+1));
e2 = AMA( e1, 2 / (T3Periods+1));
e3 = AMA( e2, 2 / (T3Periods+1));
e4 = AMA( e3, 2 / (T3Periods+1));
e5 = AMA( e4, 2 / (T3Periods+1));
e6 = AMA( e5, 2 / (T3Periods+1));
C1 = -s^3;
C2 = 3*s^2*(1+s);
C3 = -3*s*(s+1)^2;
C4 = (1+s)^3;
T3Result= c1*e6+c2*e5+c3*e4+c4*e3;
return T3Result;
}


function T3r( C, T3Sensitivity, T3Periods, ResetReference )
{
global Reset;
CPrice = IIf(Reset, ResetReference, C );
T3Periods = Min( T3Periods, BarsSince(Reset));
T3Periods = IIf(Reset,1, T3Periods );
s = T3Sensitivity;
e1 = AMA( CPrice, 2 / (T3Periods+1));
e2 = AMA( e1, 2 / (T3Periods+1));
e3 = AMA( e2, 2 / (T3Periods+1));
e4 = AMA( e3, 2 / (T3Periods+1));
e5 = AMA( e4, 2 / (T3Periods+1));
e6 = AMA( e5, 2 / (T3Periods+1));
C1 = -s^3;
C2 = 3*s^2*(1+s);
C3 = -3*s*(s+1)^2;
C4 = (1+s)^3;
T3Result= c1*e6+c2*e5+c3*e4+c4*e3;
return T3Result;
}

T3Sensitivity = Param("T3 Sensitivity",1,0.1,5,0.01);
T3Periods = Param("T3 Periods",3,1,10,1);
Reset = GapUp() OR GapDown();
ResetReference = (H+L+C)/3;
T3rPlot = T3r( C, T3Sensitivity, T3Periods, ResetReference );
Plot(C,"\nClose",IIf(Reset,2,1),128);
Plot(T3rPlot,"\nResetable T3",4,1|styleThick);
Plot(T3( C, T3Periods, T3Sensitivity),"\nTraditional T3",6,1|styleThick);

Edited by Al Venosa