Pattern Recognition Across Timeframes

TEMPORARY DRAFT

Two classical bullish patterns in daily bars.

PR001

Timeframe shifted to weekly.

Selector line moved to highlight the former Pivot Lo value.

PR002

Timeframe shifted to Monthly.

Selector line moved to highlight the former Pivot Lo value.

PR003


Note that the 2nd and third Pivot Lo’s (not marked on the charts) are not significant in the monthly timeframe i.e. the monthly chart does not truly represent the underlying waves (cycles) of the daily chart (which I claim is the natural rhythm of the market notwithstanding that the intra-day charts tell us as much, if not more, about the behaviour of market participants).


Bonus Commentary

Comparing perfect equity with a buy&hold strategy for three weeks (using an earlier section of the above chart).

The charts are linked and in different timeframes.


Perfect trades are an approximation of Pivot Hi to Pivot Lo marked in colour with corresponding % change obtained via the AB studies tooltips.

For the sake of the exercise I cheated a little on the perfect swings.

For convenience I ignored inside and outside days (not counted as a swing) -annoying little things those ID’s and OD’s – messing up my perfect theories like that.


PR005


PR004

Data Adjustment – Yahoo

The objective of this post is to introduce readers to the basic concepts of data adjustment (how and when it is applied to historical equity data) using Yahoo data as the example.

Yahoo’s historical data is raw, unadjusted, data but Yahoo does maintain, and report, an adjustment factor to manage split events (stock splits and dividends).

To view historical data (using Caterpillar Inc [CAT] as the example):

1) Enter the symbol for any stock at the Y!Finance (US) site and select Get Quotes.

2) Click on Historical Prices in the Quotes section of the left hand menu bar and a download quotes page will open (the default view is the most recent 1 -2 months of prices).

The adjustment factor is reported, with the raw data, as Adjusted Close (AdjClose).

For the current records the adjusted AdjClose and the raw Close are the same.

DA004

Note: The records are listed from bottom to top with the most recent at the top.

The recent dividend and split history is available.

To view the events record pick the Dividends Only radio button in the SET DATE RANGE panel and click on Get Prices.

DA006

A record of dividends and splits, that go as far back as the historical data itself, will open.

DA007

To check how the adjustment has been applied, for any specific split event e.g. the 14-July-05 stock split, set the date range and Get Prices to match.

DA001

Only data within the date range specified will be downloaded.

DA002

The data can be downloaded to a spreadsheet, if required, by clicking on the Download To Spreadsheet link at the bottom of the table.

Adjustment Methodology

Yahoo adjusts the close (factor) based on the standards laid down by the Center For Research In Security Priceshttp://www.crsp.com/

The guidelines can be found by searching the site using "dividend adjustment", as the criteria, or by going to the Data Description Guide (an extract from the document is attached to the end of this post).

By default, AmiBroker downloads the AdjClose and calculates the adjusted OHL ‘on the fly’, using the adjustment factor i.e. AdjClose/Close.

For additional discussion on adjustment and an explanation of how AmiQuote calculates the OHL values refer to:

YahooAmiBrokerGroup message:  http://finance.groups.yahoo.com/group/amibroker/message/93631

 AmiBroker Knowledge Base article:  http://www.amibroker.com/kb/2007/08/04/amiquote-and-free-data-from-yahoo/

Example 1 – Agilent Technology (A) dividend:

In this example, the dividend on the 1st November, 2006 , is the first split event in recent history i.e. on 2/21/2008, the date of this post, (the Close and the Adj Close are the same up until the first ex dividend day).

For the dates preceding the split, the raw prices are adjusted by Amiquote during the download process (the adjustments, for 10/31/2006, are marked in yellow).

Note: the volume (marked in green) is not adjusted.

The adjustment factor, prior to the split date, is a constant = = AdjClose/Close.

The AdjFactor, at the dividend date = = (Close – dividend)/Close = = (35.60 – 2.057)/35.60 = = 33.54/35.60 = = 0.94

DA008

example 2 – Caterpillar Inc (CAT) 2:1 split:

In this case the split is deep in the history and prior adjustments have been made for other split events i.e. the AdjClose and the Close are different prior to the split of 7/14/2005 (refer to the attached CRSP extract that contains information on compound adjustment factors).

Note: As before the Volume, marked in green, is not adjusted. The adjustment factor prior to the split, marked in blue, is halved on the split date.

DA010


ATTACHED FILE:

An extract from a Center For Research In Security Prices (CRSP) guide that details some adjustment methodologies and formulas – CRSP Dividend Adjustment (extract)

Reading/Backing-up the TWS Exported Execution Report

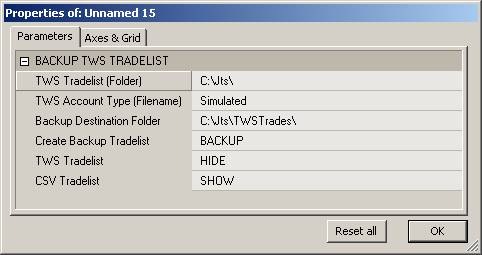
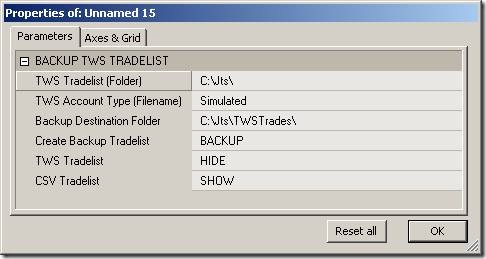
Please be sure you set up the TWS according to the instructions provided in Setting Up your TWS before you test this code. The code presented here reads the execution report, converts it to a .csv format, date-stamps it, backs it up for later use, and optionally displays it in the chart Title. The code doesn’t do anything important besides displaying the information in the Title. The idea is to show you how to read the file so that you can extract real execution prices, use them in your calculations, and plot them on your chart. The Param options are self-explanatory:

clip_image002

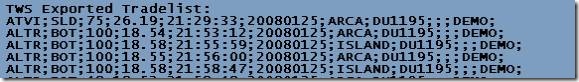
The name used for the execution report generated by the TWS is not date-stamped. For example, if you set up the TWS to export executions under the name Simulated.Trades, this same name will be used on successive days. If the TWS finds a tradelist from the previous day, it will simply overwrite it. To prevent losing this AFL readable file it is important to back up the tradelist at the end of the day. The format of the execution report exported by the TWS looks like this:

ATVI;SLD;75;26.19;21:29:33;20080125;ARCA;DU1195;;;DEMO;
ALTR;BOT;100;18.54;21:53:12;20080125;ARCA;DU1195;;;DEMO;
ALTR;BOT;100;18.58;21:55:59;20080125;ISLAND;DU1195;;;DEMO;
ALTR;BOT;100;18.55;21:56:00;20080125;ARCA;DU1195;;;DEMO;
ALTR;BOT;100;18.58;21:58:47;20080125;ISLAND;DU1195;;;DEMO;

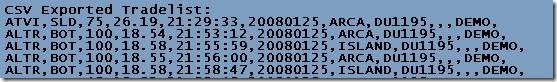
The .csv format of the backup file produced by the code below can be directly imported into Excel and looks like this (note the semicolons have been replaced by commas):

ATVI,SLD,75,26.19,21:29:33,20080125,ARCA,DU1195,,,DEMO,
ALTR,BOT,100,18.54,21:53:12,20080125,ARCA,DU1195,,,DEMO,
ALTR,BOT,100,18.58,21:55:59,20080125,ISLAND,DU1195,,,DEMO,
ALTR,BOT,100,18.55,21:56:00,20080125,ARCA,DU1195,,,DEMO,
ALTR,BOT,100,18.58,21:58:47,20080125,ISLAND,DU1195,,,DEMO,

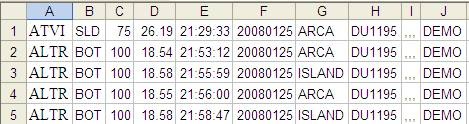
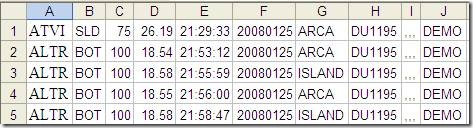
In Excel, the file will look like this after activating Text to columns:

clip_image004

Please be aware that the minimum update interval that the TWS exports the execution report is approximately one-minute. This means it will take some time for your trades to show up in the list.

Before tackling the main backup function, there are a few helper functions you will need. While these are available elsewhere on this site, they are repeated below for your convenience. To prevent conflicts between static variables used in different programs, you should key their names with those charted; see Keying Static Variables for more information on this. The DateNumToStr() converts DateNumbers to a standard date string.

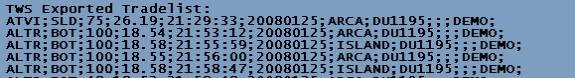
The TWSBackupTradeList( TWSInputPath ) listed below reads the TWS tradelist, extracts the date, converts it to the .csv format, saves it in a different location, and optionally displays both tradelists in the chart Title. To test this function, Apply it to a new Indicator, open the Param window, set up the parameters, and click BACKUP. The backup file is saved in the path defined by the TradebackupFolder variable. If the function finds the execution report and its display is turned on in the Param window, this should look like this in the Title (only a few lines shown):

clip_image006

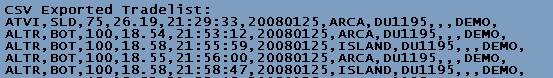
And, when displayed, the backup file should look like that below:

clip_image008


InIndicator     Status"Action" ) == 1;
StaticVarKey     GetChartID();

procedure xStaticVarSetSNameSValue )
{
    global StaticVarKey;

    if ( InIndicator )
        StaticVarSetSname StaticVarKeySvalue );
}

function xStaticVarGetSName )
{
    global StaticVarKey;
    return StaticVarGetSname StaticVarKey );
}

procedure xStaticVarSetTextSNameSValue )
{
    global StaticVarKey;

    if ( InIndicator )
        StaticVarSetTextSname StaticVarKeySvalue );
}

function xStaticVarGetTextSName )
{
    global StaticVarKey;
    return StaticVarGetTextSname StaticVarKey );
}

function DateNumToStrDtNum )
{
    DayNm roundfracDtNum 100 ) * 100 );
    MthNm roundfracDtNum 10000 ) * 100 );
    YrNm intDtNum 10000 ) + 1900;
    return NumToStrMthNm1.0 ) + "/" NumToStrDayNm1.0 ) + "/" NumToStrYrNm1.0False );
}

procedure TWSBackupTradeListTWSInputPath )
{
    global TradebackupFolderAccountType;
    fh1 fopenTWSInputPath"r" );

    if ( fh1 )
    {
        Line                 StrReplacefgetsfh1 ), ";""," );
        DateStr             StrExtractLine);
        YearNum            StrToNumStrLeftDateStr) );
        MonthNum            StrToNumStrMidDateStr4) );
        DayNum            StrToNumStrRightDateStr) );
        DateNumber         = ( YearNum 1900 ) * 10000 100 MonthNum DayNum;
        DateNumStr         NumToStrDateNumber1.0False );
        BackupFilename AccountType DateNumStr ".csv";
        BackupPath         TradebackupFolder BackupFilename;
        fclosefh1 );
    }

    fh1 fopenTWSInputPath"r" );

    fdeleteBackupPath );
    fh2 fopenBackupPath"a" );
    LineNum 0;
    TWSTradeList CSVTradelist "";

    if ( fh1 )
    {
        if ( fh2 )
        {
            while ( ! feoffh1 ) )
            {
                Line fgetsfh1 );
                TWSTradeList TWSTradeList Line;
                Line StrReplaceLine";""," );
                CSVTradelist CSVTradelist Line;
                LineNum++;

                if ( Line != "" )
                {
                    fputsLinefh2 );
                }
            }
        }

        xStaticVarSetText"TWSTradelist"TWSTradelist );

        xStaticVarSetText"CSVTradelist"CSVTradelist );
    }
    else
    {
        if ( fh1 == )
        {
            PopupWindow"Could NOT Open InputPath: " TWSInputPath,
                         "TWS EXPORTED TRADELIST"timeout 5left = -1top = -);
        }

        if ( fh2 == )
        {
            PopupWindow"Could not open OutputPath: " OutputPath,
                         "TWS EXPORTED TRADELIST"timeout 5left = -1top = -);
        }
    }

    if ( fh1 )
        fclosefh1 );

    if ( fh2 )
        fclosefh2 );

    Caption "TWS EXPORTED TRADELIST";

    Message "The TWS Tradelist: \n   " TWSInputPath " [" NumToStrLineNum1.0False ) +
              " Trades/" DateNumToStrDateNumber ) + "]" +
              " \nHas been saved in csv format as:\n   " BackupPath;

    PopupWindowMessageCaptiontimeout 20left = -1top = -);
}

_SECTION_BEGIN"BACKUP TWS TRADELIST" );
TWSInputPath                ParamStr"TWS Tradelist (Folder)""C:\\Jts\\" );
AccountType                    ParamList"TWS Account Type (Filename)""Real|Simulated|Demo");
TWSInputFilename            AccountType ".Trades";
TWSInputPath                 TWSInputPath TWSInPutFilename;
TradebackupFolder            ParamStr"Backup Destination Folder""C:\\Jts\\TWSTrades\\" );
BackupTWSTradeList        ParamTrigger"Create Backup Tradelist""BACKUP" );
ShowTWSTradeList            ParamToggle"TWS Tradelist""HIDE|SHOW");
ShowCSVTradeList            ParamToggle"CSV Tradelist""HIDE|SHOW");
_SECTION_END();

if ( BackupTWSTradeList )
    TWSBackupTradeListTWSInputPath );

TWSStr WriteIfShowTWSTradeList"\nTWS Exported Tradelist: \n" xStaticVarGetText"TWSTradelist" ) + "\n""" );

CSVStr WriteIfShowCSVTradelist"\nCSV Exported Tradelist: \n" xStaticVarGetText"CSVTradelist" ), "" );

Title TWSStr CSVStr;

Edited by Al Venosa.

Real-Time Bar Period Timing

When trading in real-time, one often needs to know when a new period starts and how much time there is left before the period ends. The code below will give you the time remaining to the next bar, the time elapsed since the start of the bar, and the second count since date-change. The timing values will automatically adjust to the selected chart interval. You can use the variables in your system’s code to time various events.

This code is shown in a demo configuration, and you will have to adapt it to your personal requirements. To test, simply Apply the code to an Indicator window. For a quick test, select the one-minute time interval.

function GetSecondNum()
{
    Time         Now);
    Seconds     intTime 100 );
    Minutes     intTime 100 100 );
    Hours     intTime 10000 100 );
    SecondNum intHours 60 60 Minutes 60 Seconds );
    return SecondNum;
}

RequestTimedRefresh);
TimeFrame Interval();
SecNumber GetSecondNum();
Newperiod SecNumber TimeFrame == 0;
SecsLeft     SecNumber intSecNumber TimeFrame ) * TimeFrame;
SecsToGo     TimeFrame SecsLeft;

if ( NewPeriod )
{
    Say"New period" );
    Plot1""colorYellowstyleArea styleOwnScale0);
}

Title "\n" +

        "  Current Time: " Now) + "\n" +
        "Chart Interval: " NumToStrTimeFrame1.0 ) + " Seconds\n" +
        " Second Number: " NumToStrSecNumber1.0False ) + "\n" +
        "  Seconds Left: " NumToStrSecsLeft1.0False ) + "\n" +
        " Seconds To Go: " NumToStrSecsToGo1.0False );

PlotC""1128 );

For verification, timing is displayed in the chart title:

clip_image002

Edited by Al Venosa.

Moving Low Level Graphics (GFX) Objects on your Charts

When drawing gfx objects on your charts, you can move them around by applying an X and Y offset to the coordinates of the object. The following code shows a simple example of how you can move a square object around your chart.

function DrawButtonTextx1y1x2y2BackColor )
{
    GfxSetOverlayMode);
    GfxSelectFont"Tahoma"12800 );
    GfxSelectPencolorBlack );
    GfxSetBkMode);
    GfxSelectSolidBrushBackColor );
    GfxSetBkColorBackColor );
    GfxSetTextColor);
    GfxRectanglex1y1x2y2 );
    GfxDrawTextTextx1y1x2y232 );
}
 
Yoffset Param"Button Row Offset (px)"5002000);
Xoffset    Param"Button Column Offset (px)"5002000);
CellHeight Param("Cell Height",20,5,200,5);   
CellWidth Param("Cell Width",120,5,200,5);  
DrawButton"TEST"XoffsetyoffsetXoffset CellWidthyOffset CellHeightcolorBlue );

If you only need to adjust the position of your object once in awhile, this simple method may serve best. However, when you want to move an object on the fly, without having to open the Param window each time, you can do this by registering the coordinates of your first click on the object and then move the object to the location of your next mouse click. The program below shows how to do this. It also shows you how to detect whether your click is within the object area (see the CursorInField variable).

To facilitate readability, the code has not been optimized. You can see in the captures below the code only adds about 4 microseconds to your execution time. It is doubtful that code optimization will have much effect on the overall execution time of your code. To test this code you Apply it to an indicator. At First Apply, it will display the Yellow Square with the word TEST in it:

clip_image002

When you click within the yellow square with your Left mouse button, it will turn Red:

clip_image004

The red color indicates that a move is in progress and that the next click will determine the location to which the object will be moved. After the move is completed, the object will return to its default yellow color:

clip_image006

In a real application, you may want to add some protective code that disables other mouse click activated actions while a move is in progress. Such code would be disabled while the object is Red and the variable MoveInProgress is true.

While the code could be (and initially was) written to move the object by holding down the Left Mouse button and dragging the object in the conventional way, the one-second minimum chart refresh rate makes this extremely awkward and slow to work with. For diagnostic purposes, a Reset button in provided in the Param window. Clicking this button will move the yellow square to its default coordinates.

function DrawButtonTextx1y1x2y2BackColor )
{
    GfxSetOverlayMode);
    GfxSelectFont"Tahoma"12800 );
    GfxSelectPencolorBlack );
    GfxSetBkMode);
    GfxSelectSolidBrushBackColor );
    GfxSetBkColorBackColor );
    GfxSetTextColor);
    GfxRectanglex1y1x2y2 );
    GfxDrawTextTextx1y1x2y232 );
}


ParamSqrSize    100;
Reset ParamTrigger"Reset Coordinates""RESET" );
xOffset  StaticVarGet"xOffset" );
YOffset  StaticVarGet"YOffset" );

if ( IsNullxOffset ) OR IsNullyOffset ) OR Reset )
{
    StaticVarSet"xOffset"20 );
    StaticVarSet"yOffset"20 );
    X1 XOffset;
    Y1 YOffset;
    X2 XOffset ParamSqrSize;
    Y2 YOffset ParamSqrSize;
    StaticVarSet"X1"X1 );
    StaticVarSet"X2"X2 );
    StaticVarSet"Y1"Y1 );
    StaticVarSet"Y2"Y2 );
    StaticVarSet"MoveinProgress"False );
}

X1 NzStaticVarGet"X1" ) );

X2 NzStaticVarGet"X2" ) );
Y1 NzStaticVarGet"Y1" ) );
Y2 NzStaticVarGet"Y2" ) );
LButtonTrigger    GetCursorMouseButtons() == 9;
MousePx  NzGetCursorXPosition) );
MousePy  NzGetCursorYPosition) );

CursorInField MousePx X1 AND MousePx X2 AND MousePy Y1 AND MousePy Y2;

MoveInProgress NzStaticVarGet"MoveInProgress" ) );

BackColor colorYellow;

if ( NOT MoveInProgress )
{
    if ( LButtonTrigger AND CursorInField )
    {
        StaticVarSet"BackColor"colorRed );
        StaticVarSet"DownPx1"MousePx );
        StaticVarSet"DownPy1"MousePy );
        StaticVarSet"MoveinProgress"True );

    }
}
else
    if ( LButtonTrigger )
    {
        StaticVarSet"BackColor"colorYellow );
        DownPx1 StaticVarGet"DownPx1" );
        DownPy1 StaticVarGet"DownPy1" );
        xMove MousePx DownPx1;
        yMove MousePy downPy1;
        PrevxOffset StaticVarGet"xOffset" );
        PrevYOffset StaticVarGet"YOffset" );
        xOffset PrevxOffset xMove;
        yOffset PrevYOffset yMove;
        StaticVarSet"xOffset"xOffset );
        StaticVarSet"yOffset"yOffset );
        StaticVarSet"MoveinProgress"False );
    }


BackColor NzStaticVarGet"BackColor" ), colorYellow );

xOffset StaticVarGet"xOffset" );
YOffset StaticVarGet"YOffset" );
X1 XOffset;
Y1 YOffset;
X2 XOffset ParamSqrSize;
Y2 YOffset ParamSqrSize;
StaticVarSet"X1"X1 );
StaticVarSet"X2"X2 );
StaticVarSet"Y1"Y1 );
StaticVarSet"Y2"Y2 );
DrawButton"TEST"x1y1x2y2BackColor );

Edited by Al Venosa.

Restore Last Used Range v2

When starting up AmiBroker the chart range defaults to the last number of bars set in Preferences. This means that in virtually all cases you have to manually zoom and restore the chart range you were previously working with. This post presents a function that will restore the last used range before you shut down AmiBroker. If you like to use this function routinely, you can copy the functions below to your default #Include file and place this call at the top of your code:

<p>RestoreLastUsedRange();</p>

This function checks the contents of a static variable named “StartUp”+ChartIDStr. This static variable will return a NULL the first time it is called. When this happens, the ZoomToIndex() is called. This function retrieves the last used range for the current chartID from your hard disk and zooms to this range. The Plot() and Title statements are added to help you verify proper operation. You can also uncomment the two _TRACE() commands and start up DebugView for further diagnostic purposes.

If you do not have it yet, be sure to create a folder for the PersistentVariables, as shown at the top of the code. This is where the First and Last Indexes, which point to the start and end of the range being restored, are saved in a small file. You can open these with Notepad to help debugging operations.

//Pay attention to the double slashes in the path line. They need to be there.

// This creates the folder for PersistentPath variables if it doesn't exist
PersistentPath StaticVarGetText"~PersistentPath" );

if ( PersistentPath == "" // Ensures this folder exists
{
    PersistentPath "PersistentVariables\\";
    fmkdirPersistentPath );
    StaticVarSetText"~PersistentPath"PersistentPath );
}

function PersistentVarGetVarName )

{
    global PersistentPath;
    fh fopenPersistentPath VarName ".pva""r" );

    if ( fh )
    {
        String fgetsfh );
        fclosefh );
    }
    else
        string "";

    Number StrToNum( String );

    return Number;
}

function PersistentVarSetVarNameNumber )
{
    global PersistentPath;
    String NumToStrNumber1.3False );
    fh fopenPersistentPath VarName ".pva""w" );

    if ( fh )
    {
        fputsStringfh );
        fclosefh );
    }

    return fh;
}

procedure ZoomToIndexFirstBarIndexLastBarIndex )
{
    DT DateTime();
    BI BarIndex();
    FirstDateTime LastValueValueWhenFirstBarIndex == BIDT ) );
    LastDateTime LastValueValueWhenLastBarIndex == BIDT ) );

    FirstDateTimestr DateTimeToStrFirstDateTime );
    LastDateTimestr DateTimeToStrLastDateTime );

    AB CreateObject"Broker.Application" );
    AW AB.ActiveWindow;
    AW.ZoomToRangeFirstDateTimestrLastDateTimestr );
    //_TRACE( FirstDateTimestr +", "+LastDateTimestr );
}

function RestoreLastUsedRange()
{
    if ( Status"Action" ) == // Only perform ranging in an indicator
    {
        // is this a "start-up execution?
        ChartIDStr NumToStrGetChartID(), 1.0False );
        PrevFirstBarIndex PersistentVarGet"FirstBarIndex" ChartIDStr ); // Recall last positions
        PrevLastBarIndex PersistentVarGet"LastBarIndex" ChartIDStr );

        if ( IsNullStaticVarGet"StartUp" ChartIDStr ) ) )
        {
            ZoomToIndexPrevFirstBarIndexPrevLastBarIndex );
            StaticVarSet"StartUp" ChartIDStrTrue );
            //_TRACE( "# StartUp Zoom: CHARTID: " + ChartIDStr + ", PrevFirstBI: " + PrevFirstBarIndex + ", PrevLastBI: " + PrevLastBarIndex );
        }

        // Update zoom range on disk
        FirstBarIndex Status"firstvisiblebarindex" );

        LastBarIndex Status"lastvisiblebarindex" );

        if ( PrevFirstBarIndex != FirstBarIndex OR PrevLastBarIndex != LastBarIndex )
        {
            PersistentVarSet"FirstBarIndex" ChartIDStrFirstBarIndex );
            PersistentVarSet"LastBarIndex" ChartIDStrLastBarIndex );
            //_TRACE( "# Update Zoom Range: CHARTID: " + ChartIDStr + ", FirstBI: " + FirstBarIndex + ", LastBI: " + LastBarIndex );
        }
    }
}

_SECTION_BEGIN"RESTORE RANGE" );

if ( ParamTrigger"Clear all Static Variables""CLEAR" ) )
    StaticVarRemove"*" );

PlotC""1128 );

SetBarsRequiredsbrAllsbrAll );

RestoreLastUsedRange();

Title "\n" +
        " ChartIDStr: " NumToStrGetChartID(), 1.0False ) + "\n" +
        " FirstIndex: " Status"firstvisiblebarindex" ) + "\n" +
        "  LastIndex: " Status"Lastvisiblebarindex" ) + "\n" +
        "Selected BI: " BarIndex();
_SECTION_END();

Edited by Al Venosa.