In the previous post I developed a method to link prices between the TDash window and the Main Chart window. In this post I show how I used this technique to develop “Order Markers” that can be used to modify orders, display order status, and cancel orders.
In the final TDash Order Markers will be created automatically whenever an order is found Pending. The initial orders will be placed with another tool (the QBar) that will be covered in a subsequent post.
To test the Order markers you need to create two side-by-side windows in AmiBroker. If you use multiple monitors you can place the Main Chart at the right side of the left monitor, and TDash on left side of the right monitor. This will work fine and gives you a lot of space to work with. However, depending on the monitor sizes and their horizontal positions, the Markers may not appear perfectly at the same height from your desk, however the prices shown and plotted will be accurate.
To install the programs, first open and copy this TDashInclude.afl include file (not listed below due to its size) to the AmiBroker default Include folder. The TDashInclude.afl file is a development version and contains a lot of code that you don’t need at this time – please ignore the unused functions. The include will be cleaned up when the functions all work as they should. Next Apply MainMarkers.afl (listed below) to the main chart at the left, and Apply TDashMarkers.afl (listed below) to the TDash window at the right.
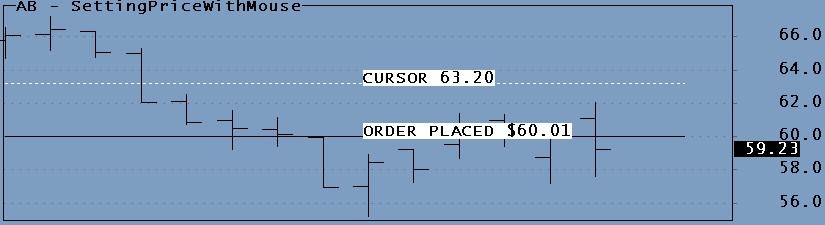
The demo code presented here creates three Order Markers, each can be moved by dragging it to a new price level. At start-up the Order markers will be parked at the top of the TDash window, just click on them to activate them. Remember that in the final TDash inactive Order Markers will not show, only Order Markers for Pending orders will show.
The price line and value displayed on the main chart will track the Order Marker, and the Order Markers will track a changing Y-axis on the Main chart. To allow setting an exact price Increment (+) and Decrement (-) controls are provided on the Marker. To cancel the order click the Cancel control (X). In this test cancel will only gray-out the marker and park it at the top of the TDash window, in the final program a canceled Marker will disappear after the cancellation has been confirmed.
It should look and work as shown in this video below.
// TDashMainMarkers.afl

PersistentPath = StaticVarGetText( "~PersistentPath" ); // Global
if ( PersistentPath == "" )
{
    PersistentPath = "PersistentVariables\\";
    fmkdir( PersistentPath );
    StaticVarSetText( "~PersistentPath", PersistentPath );
}

function PersistentVarRemove( VarName )
{
    global PersistentPath;
    Fn = PersistentPath + VarName + ".pva";
    fh = fdelete( Fn ) ;
    return fh;
}

function PersistentVarGet( VarName )
{
    global PersistentPath;
    fh = fopen( PersistentPath + VarName + ".pva", "r" );
    if ( fh )
    {
        String = fgets( fh );
        fclose( fh );
        Number = StrToNum( String );
    }
    else Number = Null;
    return Number;
}

function PersistentVarSet( VarName, Number )
{
    global PersistentPath;
    String = NumToStr( Number );
    fh = fopen( PersistentPath + VarName + ".pva", "w" );
    if ( fh )
    {
        fputs( String, fh );
        fclose( fh );
    }
    return fh;
}

function MAinLinkWitTDash( MArkername )
{
    local xMY;
    // On first run try to get persistent price
    if ( IsNull( StaticVarGet( "~MarkerInit_" + MArkerName ) ) )
    {
        Price = PersistentVarGet( "MainChartPrice_" + MarkerName );
        if ( Price > 0 )
        {
            Miny = Status( "axisminy" );
            Maxy = Status( "axismaxy" );
            PxChartRange = Status( "pxchartheight" );
            Pricerange = MaxY - MinY;
            TDashYPixels = ( MaxY - Price ) * PxChartRange / Pricerange + 5;
            StaticVarSet( "~TDashYPixels_" + MarkerName, TDashYPixels );
            StaticVarSet( "~MainChartPrice_" + MarkerName, Price );
            StaticVarSet( "~Exists_" + MarkerName, True );
        }
        StaticVarSet( "~MarkerInit_" + MArkerName, True );
    }

    MArkerEnabled = Nz( StaticVarGet( "~Exists_" + MarkerName ) );
    if ( MArkerEnabled )
    {
        pxWidth = Status( "pxWidth" );
        Miny = Status( "axisminy" );
        Maxy = Status( "axismaxy" );
        pxchartright = Status( "pxchartright" );
        pxchartbottom = Status( "pxchartbottom" );
        pxcharttop = Status( "pxcharttop" );
        PxChartRange = Status( "pxchartheight" );
        pxheight = Status( "pxheight" );
        Pricerange = MaxY - MinY;

        // TDash releases get TDash y-pixel value and convert to price
        if ( Nz( StaticVarGet( "~LeftButtonRelease" ) ) )
        {
            TDashYPixels = Nz( StaticVarGet( "~TDashYPixels_" + MarkerName ) );        // Y pixels from TDash window
            Price = Maxy - ( Pricerange / PxChartRange * ( TDashYPixels - 5 ) );
            StaticVarSet( "~LeftButtonRelease", False );
            StaticVarSet( "~MainChartPrice_" + MarkerName, Price );
        }
        else
            if ( Nz( StaticVarGet( "~NowDragging_" + MarkerName ) ) == 0 )     // TDash marker tracks main window
            {
                Price = Nz( StaticVarGet( "~MainChartPrice_" + MarkerName ) );
                TDashYPixels = ( MaxY - Price ) * PxChartRange / Pricerange + 5;
                StaticVarSet( "~TDashYPixels_" + MarkerName, TDashYPixels );         // Y pixels calculated from price in main chart
            }
            else
                if ( Nz( StaticVarGet( "~NowDragging_" + MarkerName ) ) )             // Main window tracks TDash window
                {
                    TDashYPixels = Nz( StaticVarGet( "~TDashYPixels_" + MarkerName ) );
                    Price = Maxy - ( Pricerange / PxChartRange * ( TDashYPixels - 5 ) );
                    StaticVarSet( "~MainChartPrice_" + MarkerName, Price );  // Price for main chart calculated from TDash y pixels
                }

        Price = Nz( StaticVarGet( "~MainChartPrice_" + MarkerName ) );

        MArkerColor  = Nz( StaticVarGet( "~MarkerColor_" + MarkerName ) );
        MArkerTextColor = Nz( StaticVarGet( "~MarkerTextColor_" + MarkerName ) );
        MArkerPenColor = Nz( StaticVarGet( "~MarkerPenColor_" + MarkerName ) );

        GfxSetBkMode( 1 );
        GfxSelectPen( MArkerColor, 1, 1 );
        GfxMoveTo( 0, TDashYPixels );
        GfxLineTo( pxwidth, TDashYPixels );

        GfxSetBkMode( 2 );
        GfxSetBkColor( MArkerColor );
        GfxSetTextColor( MArkerTextColor );
        GfxSelectFont( "Lucida Console", FontSize = 10, FontWeight = 700 );
        GfxDrawText( NumToStr( Price, 1.2, False ), pxchartright, TDashYPixels - FontSize, pxwidth, TDashYPixels + Fontsize, 37 );
    }
}

function DrawQBarPriceLine()
{
    if( Nz( StaticVarGet( "~QBarVisible" ) ) )
    {
        pxWidth = Status( "pxWidth" );
        Miny = Status( "axisminy" );
        Maxy = Status( "axismaxy" );
        pxchartright = Status( "pxchartright" );
        pxchartbottom = Status( "pxchartbottom" );
        pxcharttop = Status( "pxcharttop" );
        PxChartRange = Status( "pxchartheight" );
        pxheight = Status( "pxheight" );
        Pricerange = MaxY - MinY;

    QBarColor  = Nz( StaticVarGet( "~QBarColor" ) );
    QBarTextColor = Nz( StaticVarGet( "~QBarTextColor" ) );
    QBarPenColor = Nz( StaticVarGet( "~QBarPenColor" ) );

    QBarColor = Nz( StaticVarGet( "~ActionColor" ) );
    QBarTextColor = Nz( StaticVarGet( "~ActionTextColor" ) );

    QBarYPixel = Nz( StaticVarGet( "~QBarYPixel" ) );        // Y pixels from TDash window
    Price = Maxy - ( Pricerange / PxChartRange * ( QBarYPixel - 5 ) );
    GfxSetBkMode( 1 );
    GfxSelectPen( QBarColor, 1, 1 );
    GfxMoveTo( 0, QBarYPixel );
    GfxLineTo( pxwidth, QBarYPixel );

    GfxSetBkMode( 2 );
    GfxSetBkColor( QBarColor );
    GfxSetTextColor( QBarTextColor );
    GfxSelectFont( "Lucida Console", FontSize = 10, FontWeight = 700 );
    GfxDrawText( NumToStr( Price, 1.2, False ), pxchartright, QBarYPixel - FontSize, pxwidth, QBarYPixel + Fontsize, 37 );
    }
}


_SECTION_BEGIN( "Global Parameters" );
if ( ParamTrigger( "Clear StaticVar (TEST)", "CLEAR" ) ) // to simulate start up
{
    StaticVarRemove( "*" );
}

if ( ParamTrigger( "Clear Persistent Var", "CLEAR" ) ) // to simulate start up
{
    PersistentVarRemove( "MainChartPrice_" + "TARGET" );
    PersistentVarRemove( "MainChartPrice_" + "MAIN" );
    PersistentVarRemove( "MainChartPrice_" + "STPLOSS" );
}
_SECTION_END();

GfxSetOverlayMode( 0 );
MAinLinkWitTDash( "BUY" );
MAinLinkWitTDash( "MAIN" );
MAinLinkWitTDash( "SELL" );
DrawQBarPriceLine();
Plot( C, "", colorBlack, styleBar );
RequestTimedRefresh( 0.1 );
// TDashMarkers
#pragma nocache
#include <TDashInclude.afl>

_SECTION_BEGIN( "TDASH MARKERS" );
setBackGroundColor( ParamColor( "TDash background", colorLightBlue ) );

// Set default font size
FontSize = Nz( StaticVarGet( "~FontSize" ) );
FontName = "ARIAL";
Fontweight = 700;
GfxSelectFont( FontName, FontSize, FontWeight );

// Columns. Most parameters are for experimentation and can be hard-coded
NumberCols = Param( "Number Button Columns", 8, 1, 20, 1 );
ButtonWidth = Status( "pxwidth" ) / NumberCols;
MaxButtonWidth = Param( "Max Button Width", 150, 1, 500, 1 );
ButtonWidth = Min( ButtonWidth, MaxButtonWidth );
MaxMarkerWidth = Param( "Max Button Width", 150, 1, 500, 1 );
MarkerWidth = Min( ButtonWidth, MaxMarkerWidth );

// Rows
NumberRows = Param( "Number Button Rows", 20, 1, 50, 1 );
ButtonHeight = Status( "pxheight" ) / NumberRows;
MaxButtonHeight = Param( "Max Button Height", 50, 1, 100, 1 );
ButtonHeight = Min( ButtonHeight, MaxButtonHeight );
MinButtonHeight = Param( "Min Button Height", 50, 1, 100, 1 );
ButtonHeight = Max( ButtonHeight, MinButtonHeight );

MarkerHeight = ButtonHeight;

TipsOn = ParamToggle( "Help Tips", "HIDE|SHOW", 0 );
ShowTips = ParamToggle( "Help Tips", "HIDE|SHOW", 0 );
ClickSound = ParamToggle( "Click Sound", "OFF|ON", 1 );

SetChartOptions( 0, chartHideQuoteMarker );
GfxSetOverlayMode( 2  );

// mouse
MX = GetCursorXPosition( 1 );
MY = GetCursorYPosition( 1 );
LeftClick = Nz( StaticVarGet( "~LeftClick" ) ); //Left Click SV set at end of code
LeftDown = GetCursorMouseButtons() == 1;

OnTDash     = !IsNull( MX ) AND !IsNull( MY );
LeftClick = LeftClick AND OnTDash;    // Only accept mouse clicks when cursor is inside TDash window
LeftDown = ( LeftDown OR LeftClick ) AND OnTDash;

PrevLeftButtonState = Nz( StaticVarGet( "~LeftButtonState" ) );
LeftButtonRelease = LeftDown < PrevLeftButtonState AND OnTDash;
StaticVarSet( "~LeftButtonState", LeftDown ); // Release is also detected outside TDash window

// testing markers
MArkerTip = "Drag Price Marker to desired price Level. Click 'X' to cancel, '+' to increment, and '-' to decrement";
ServiceMarkers( "TARGET", colorBrightGreen, colorBlack, colorBlack, MArkerTip );
ServiceMarkers( "MAIN", colorBlue, colorWhite, colorBlack, MArkerTip   );
ServiceMarkers( "STPLOSS", colorRed, colorBlack, colorBlack, MArkerTip   );

// testing
AddRowTogfxTitle( "                TDashAction: "+VarGetText( "TDashAction"), colorBlack, FontSize=10 );

// The following lines are always located at the end of the code
ShowTip( BrushColor = colorYellow, OutlineColor = colorBlack, TextColor = colorBlack, TipWidth = 150, TipHeight = 100, 8, TipsOn );
LeftClick = GetCursorMouseButtons() == 9;
StaticVarSet( "~LeftClick", LeftClick );
RequestTimedRefresh( 0.1 );
_SECTION_END();
 Filed by Herman at 11:14 pm under Developing a RT Trading Dashboard


