March 16, 2008
Setting prices with your cursor
To place LMT or STP orders quickly is easiest done by moving the horizontal cursor-line over the desired price and making a left mouse click. The demo code below shows how you can lock in prices this way. To Chart-Trade additional code must be added to make the click perform one task of many, and only do so when required. When you Apply the code below to an indicator you will see a dashed line at the cursor price. This dashed line refreshes only once per second with a local database, however, it will speed up when your chart is refreshed more frequently when working with live data.
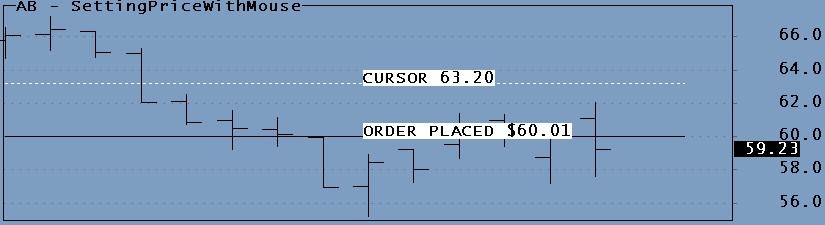
Suppose you want to place a LMT order at $60.00 on the chart below. To do this you move the dashed line over the $60.00 price and click the Left mouse button. This will place a stationary solid line. You can now move your cursor to another price and click again, the solid line will move to this new location. In actual trading you can follow the price in real time and adjust your Limit prices so that they stay exactly where you want them. The chart produced by this demo code looks like this:
In Chart-Trading the first click that places the solid line would also place your order on the TWS. Each subsequent click would modify the order to the new price. This way you can adjust several prices on your chart, setting and moving around Entries, Targets, Stops, etc.
RequestTimedRefresh( 1 );
SetChartOptions( 2, chartHideQuoteMarker );
LButtonDown = GetCursorMouseButtons() == 9;
MousePrice = GetCursorYPosition();

if ( MousePrice )
{
    StaticVarSet( "MousePrice", MousePrice );
    if ( LButtonDown )
        StaticVarSet( "ClickedMousePrice", MousePrice );
}

LB = BarCount - 1;
MousePrice = Nz( StaticVarGet( "Mouseprice" ), Null );
ClickedMousePrice = StaticVarGet( "ClickedMousePrice" );

Plot( C, "", 1, 128 );
Plot( MousePrice, "", colorWhite, 1 | styleNoRescale | styleDashed | styleNoLabel, 0, 0, 2 );
PlotText( "CURSOR " + NumToStr( MousePrice[LB], 1.2 ), LB - 5, MousePrice[LB], colorBlack, colorWhite );
Plot( ClickedMousePrice, "", colorBlack, 1 | styleNoLabel | styleNoRescale, 0, 0, 2 );
PlotText( "ORDER PLACED $" + NumToStr( ClickedMousePrice[LB], 1.2 ), LB - 5, ClickedMousePrice[LB], colorBlack, colorWhite );
 Filed by Herman at 11:20 pm under Real-Time Chart-Trading
Comments Off on Setting prices with your cursor