When you are developing a Real-Time trading system, often the first problem you have to solve is to prevent repeat orders. Repeat orders can occur when a signal remains true over several bars or chart refreshes, and each new bar/refresh sends out a new order. This can result in unintentional pyramiding.
Another ordering problem can occur when your entry and exit prices are too close together with respect to price volatility. In this case, the price volatility can whipsaw you in and out of positions in rapid succession. When this happens, slippage and commissions will quickly erode any profits you may have had. Also, if your system cannot keep up with each signal, you may end up in an opposing trade.
A common mistake when attempting to prevent repeat orders is to wait for order confirmation from the TWS after each partial fill. The problem here is that confirmations from the TWS are always subject to significant delay, and they will often let several repeat orders slip through before the acknowledgment is received.
Another flawed method is to filter or smooth the price arrays. Although this may prevent repeat orders, the lag introduced by this technique will kill most systems.
There is no single best way to prevent repeat orders. Your solution will depend on your personal preferences and the principle of your trading system. Under certain conditions you may want to combine several of the methods shown below. The examples presented here are intended to make you aware of the problems involved and suggest some possible solutions. It is your responsibility to modify the code to suit your particular system’s requirements.
To test the demo codes below, you will need to have the TWS running and connected to the IB eDemo or your paper trading account. To keep the programs below as simple as possible, you have to reset the programs after changing the Transmit ParamToggle from Off to On.
Using OrderIDs to prevent repeat orders
When your program calls the PlaceOrder() or ModifyOrder() function, the IBc returns a unique OrderID. The OrderID uniquely identifies the order you placed so that you can refer to it later to modify, cancel, or check order status. The OrderID only acknowledges that the order was placed; it does not mean that the order was transmitted to the market or was filled.
If an OrderID has been received, this means that the order was placed. You can prevent order repeats by checking whether the OrderID has a value. Then, if you only place orders when the OrderID is empty, you cannot place repeat orders. The first example below lets you explore this procedure.
After an order has been filled or cancelled, you may eventually want to transmit a new order. In this case, you will have to define a rule for clearing the OrderID. This rule can be based on order status, a contrary signal, a time delay, the start of a new bar, or any number of things. Note that after you have cleared an OrderID, you can no longer modify or cancel the order it referred to. Hence, you should only clear an OrderID if you are sure that the OrderID is no longer needed, i.e., the order was confirmed cancelled, filled, or rejected.
The method below demonstrates how to use the OrderID, and because it still allows you to enter and exit (whipsaw) a position within milliseconds, it is only a first step to preventing repeats and whipsaws. To run this demo, Insert the code into a chart pane. When you open the Param window you will see these options:
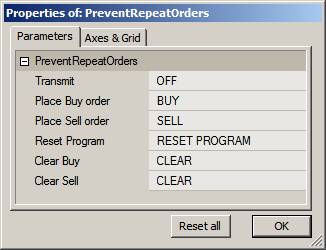
The Chart Title shows IBc connection, OrderID, and Position status. Note that while Interactive Brokers calls all the messages ‘error’ messages, many are just harmless notifications. For more details on these error messages see API Error Messages.

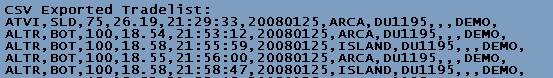
When you click the Buy button, the Title will display the OrderID for the order placed, Order Status, and the position size if the order was filled. If you watch closely when you place an order, you may see order status change, for example from PreSubmitted to Filled:

In this demo you clear the OrderIDs manually. In a real system it would be cleared when your system is ready to allow the next order to go out.
RequestTimedRefresh( 1 );
ibc = GetTradingInterface("IB");
Transmit = ParamToggle("Transmit","OFF|ON",0);
BuyOrderTrigger = ParamTrigger("Place Buy order","BUY");
SellOrderTrigger = ParamTrigger("Place Sell order","SELL");
Reset = ParamTrigger("Reset Program","RESET PROGRAM");
ClearBuyOrderID = ParamTrigger("Clear Buy","CLEAR");
ClearSellOrderID = ParamTrigger("Clear Sell","CLEAR");
BuyOrderID = StaticVarGetText("BuyOrderID");
SellOrderID = StaticVarGetText("SellOrderID");


BuyPending = ibc.IsOrderPending(BuyOrderID);
SellPending = ibc.IsOrderPending(SellOrderID);
if( BuyOrderTrigger AND BuyOrderID == "" )
{
BuyOrderID= ibc.PlaceOrder( Name(), "Buy", 100, "MKT", 0, 0, "Day", Transmit);
StaticVarSetText("BuyOrderID",BuyOrderID);
SetChartBkColor( colorBrightGreen );
}
if( SellOrderTrigger AND SellORderID == "")
{
SellORderID = ibc.PlaceOrder( Name(), "Sell", 100, "MKT", 0, 0, "Day", Transmit);
StaticVarSetText("SellOrderID",SellOrderID);
SetChartBkColor( colorRed );
}
else if( Reset )
{
StaticVarSetText("BuyOrderID","");
if( BuyPending ) ibc.CancelOrder( BuyOrderID );
StaticVarSetText("SellOrderID","");
if( SellPending ) ibc.CancelOrder( SellOrderID );
ibc.CloseAllOpenPositions();
}
else if( ClearBuyOrderID AND BuyOrderID != "" )
{
StaticVarSetText("BuyOrderID","");
if( BuyPending ) ibc.CancelOrder( BuyOrderID );
}
else if( ClearSellOrderID AND SellOrderID != "" )
{
StaticVarSetText("SellOrderID","");
if( SellPending ) ibc.CancelOrder( SellOrderID );
}
LastTWSMsg = ibc.getLastError( 0 );
Title = "\n"+
"Last TWS Error Msg: "+LastTWSMsg+"\n"+
" BuyOrder Status: "+WriteIf( BuyOrderID != "", BuyOrderID+" "+ibc.GetStatus( BuyORderID, True ),"")+"\n"+
" SellOrder Status: "+WriteIf( SellOrderID != "", SellOrderID+" "+ibc.GetStatus( SellORderID, True ),"")+"\n"+
" TWS Position Size: "+NumToStr(ibc.GetPositionSize( Name() ),1.0,False);
Clearing OrderIDs at the Start of a New Bar
In this example the OrderIDs are automatically cleared at the start of a new bar. This limits each type of trade (Buy, Sell, short, or Cover) to one per bar. If you want to place a new order while an order is pending, you may either cancel it first or modify the pending order.
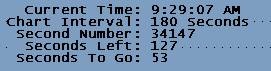
Since the start of a new bar can only be detected when its first quote arrives, it is impossible to get a fill at this time. The earliest time an order can be filled is on the second quote of the bar. How long this takes depends on market volume and whether you use eSignal (trades) or IB data (snapshots). Since the Opening quote can occur at any time during the bar interval, it may take from zero to the full bar interval before the OrderIDs are cleared. To prevent this delay, you can clear the orders with reference to your system’s clock. However, this requires that your system is perfectly synchronized with the market-time (see next example).
The best way to test this example is to use a 1-minute database and set your chart to the 5-minute timeframe. Next, open the Bar-Replay tool, select a range, and set the Step Interval to 1 minute and the Step Rate to 1/Sec.
The chart background will flash Green when a Buy order is placed, Red when a Sell order is placed, and White when a NewBar is started. You can test blocking of repeat orders by manually placing orders in rapid succession. The example code below will only place one Buy and/or Sell order during each bar-period (between White flashes). This method does allow you to take quick profits when both your entry and exit price are hit within one bar period. However you can do this only once per bar.
RequestTimedRefresh( 1 );
ibc = GetTradingInterface("IB");
Transmit = ParamToggle("Transmit","OFF|ON",0);
BuyTrigger = ParamTrigger("Place Buy order","BUY");
SellTrigger = ParamTrigger("Place Sell order","SELL");
Reset = ParamTrigger("Reset All","RESET");
PrevTN = StaticVarGet("TimeNumber");
TN = LastValue(TimeNum());
NewBar = TN != PrevTN;
StaticVarSet("TimeNumber",TN);
BuyOrderID = StaticVarGetText("BuyOrderID");
SellOrderID = StaticVarGetText("SellOrderID");
BuyPending = ibc.IsOrderPending(BuyOrderID);
SellPending = ibc.IsOrderPending(SellOrderID);
if( NewBar )
{
if( NOT BuyPending ) StaticVarSetText("BuyOrderID","");
if( NOT SellPending ) StaticVarSetText("SellOrderID","");
SetChartBkColor( colorWhite );
}
if( BuyTrigger AND BuyOrderID == "" )
{
BuyOrderID= ibc.ModifyOrder( BuyOrderID, Name(), "Buy", 100, "MKT", 0, 0, "Day", Transmit);
StaticVarSetText("BuyOrderID",BuyOrderID);
SetChartBkColor( colorBrightGreen ) ;
}
else if( SellTrigger AND SellOrderID == "" )
{
SellORderID = ibc.ModifyOrder( SellORderID , Name(), "Sell", 100, "MKT", 0, 0, "Day", Transmit);
StaticVarSetText("SellOrderID",SellOrderID);
SetChartBkColor( colorRed ) ;
}
else if( Reset )
{
StaticVarSetText("BuyOrderID","");
if( BuyPending ) ibc.CancelOrder( BuyOrderID );
StaticVarSetText("SellOrderID","");
if( SellPending ) ibc.CancelOrder( SellOrderID );
ibc.CloseAllOpenPositions();
}
LastTWSMsg = ibc.getLastError( 0 );
BuyStatus = WriteIf( BuyOrderID != "", BuyOrderID+", Status: "+ibc.GetStatus( BuyORderID, True ),"");
SellStatus= WriteIf( SellOrderID != "", SellOrderID+", Status: "+ibc.GetStatus( SellORderID, True ),"");
LastBuyTime= Nz(StaticVarGet("LastBuyTime"));
LastSellTime= Nz(StaticVarGet("LastSellTime"));
Title = "\n"+
"Last TWS Error Msg: "+LastTWSMsg+"\n"+
" BuyOrderID: "+BuyStatus+"\n"+
" SellOrderID: "+SellStatus+"\n"+
"TWS Position Size: "+NumToStr(ibc.GetPositionSize( Name() ),1.0,False);
Plot(C,"Close",colorBlack,styleBar);
Clearing OrderIDs after a Delay
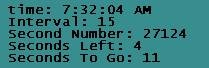
This example maintains a delay between same-type orders. It uses a delay-timer for each type of trade and clears the OrderIDs when the delay times out.
If you set the delay to the bar-interval and if your system clock were synchronized with the market, then this method would give similar results to the NewBar method discussed earlier. However, this method is better since it enables you to place your LMT orders before the Open of the bar, thus giving you a one-quote timing advantage. This may not sound like much, but in fast trading, especially during moderate trading volume, this improves your chances of getting LMT fills.
Again, the best way to test this example is to use a 1-minute database and set your chart to the 5-minute timeframe. Next, open the Bar-Replay tool, select a range, and set the Step Interval to 1 minute and the Step Rate to 1/Sec.
Experiment with the parameter options and observe that you cannot place a same-type order before the delay has timed out (see Chart Title).
RequestTimedRefresh( 1 );
ibc = GetTradingInterface("IB");
Transmit = ParamToggle("Transmit","OFF|ON",0);
BuyTrigger = ParamTrigger("Place Buy order","BUY");
BuyLockoutPeriod = Param("BuyLockoutPeriod",10,1,300,1);
SellLockoutPeriod = Param("SellLockoutPeriod",10,1,300,1);
SellTrigger = ParamTrigger("Place Sell order","SELL");
Reset = ParamTrigger("Reset All","RESET");
BuyOrderID = StaticVarGetText("BuyOrderID");
SellOrderID = StaticVarGetText("SellOrderID");
BuyPending = ibc.IsOrderPending(BuyOrderID);
SellPending = ibc.IsOrderPending(SellOrderID);
RequestTimedRefresh( 1 );
NewSecond = Status("redrawaction");
if( NewSecond )
{
BuyCountDown = Max( 0, Nz(StaticVarGet("BuyCountDown"))-1);
StaticVarSet("BuyCountDown", BuyCountDown);
if( BuyCountDown == 0 AND NOT BuyPending ) StaticVarSetText("BuyOrderID","");
SellCountDown = Max( 0, Nz(StaticVarGet("SellCountDown"))-1);
StaticVarSet("SellCountDown", SellCountDown);
if( SellCountDown == 0 AND NOT SellPending ) StaticVarSetText("SellOrderID","");
}
BuyCountDown = Nz(StaticVarGet("BuyCountDown"));
SellCountDown = Nz(StaticVarGet("SellCountDown"));
if( BuyTrigger AND ( BuyOrderID == "" AND BuyCountDown == 0 ) )
{
BuyOrderID= ibc.ModifyOrder( BuyOrderID, Name(), "Buy", 100, "MKT", 0, 0, "Day", Transmit);
StaticVarSetText("BuyOrderID",BuyOrderID);
StaticVarSet("BuyCountDown", BuyLockoutPeriod);
SetChartBkColor( colorBrightGreen );
}
else if( SellTrigger AND ( SellOrderID == "" AND SellCountDown == 0 ) )
{
SellORderID = ibc.ModifyOrder( SellORderID , Name(), "Sell", 100, "MKT", 0, 0, "Day", Transmit);
StaticVarSetText("SellOrderID",SellOrderID);
StaticVarSet("SellCountDown", SellLockoutPeriod);
SetChartBkColor( colorRed );
}
else if( Reset )
{
StaticVarSetText("BuyOrderID","");
if( BuyPending ) ibc.CancelOrder( BuyOrderID );
StaticVarSetText("SellOrderID","");
if( SellPending ) ibc.CancelOrder( SellOrderID );
ibc.CloseAllOpenPositions();
}
LastTWSMsg = ibc.getLastError( 0 );
BuyStatus = WriteIf( BuyOrderID != "", BuyOrderID+", Status: "+ibc.GetStatus( BuyORderID, True ),"");
SellStatus= WriteIf( SellOrderID != "", SellOrderID+", Status: "+ibc.GetStatus( SellORderID, True ),"");
LastBuyTime= Nz(StaticVarGet("LastBuyTime"));
LastSellTime= Nz(StaticVarGet("LastSellTime"));
Title = "\n"+
"Last TWS Error Msg: "+LastTWSMsg+"\n"+
" BuyOrderID: "+BuyStatus+"\n"+
" BuyCountDown: "+NumToStr(BuyCountDown,1.0,False)+" Sec.\n"+
" SellOrderID: "+SellStatus+"\n"+
" SellCountDown: "+NumToStr(SellCountDown,1.0,False)+" Sec."+"\n"+
" TWS Position Size: "+NumToStr(ibc.GetPositionSize( Name() ),1.0,False);
Plot(C,"Close",colorBlack,styleBar);
Alternating Trades
If your system trades LMT orders, you can design your orders to alternate between Long and Short without any limitations.
This method is well suited for reversal systems and high speed trading.
If your limit prices are set properly, this method will allow a fast sequence of reversal trades that can be very profitable. Systems like this may make several trades per minute, sometimes for several minutes, during high volatility.
In the following example, Order Status is checked, and an opposite order is only allowed to pass if the previous order has been filled. Note that this demo does not work if the Transmit ParamToggle is turned Off because under that condition no orders are transmitted to the market and can thus never be filled.
Again, the best way to test this example is to use a 1-minute database and set your chart to the 5-minute timeframe. Next open the Bar-Replay tool, select a range, and set the Step Interval to 1 minute and the Step Rate to 1/Sec.
RequestTimedRefresh( 1 );
ibc = GetTradingInterface("IB");
Transmit = ParamToggle("Transmit","OFF|ON",0);
Reset = ParamTrigger("Reset All","RESET");
BuyTrigger = ParamTrigger("Place Buy order","BUY");
SellTrigger = ParamTrigger("Place Sell order","SELL");
LastTrade = StaticVarGetText("LastTrade");
BuyOrderID = StaticVarGetText("BuyOrderID");
SellOrderID = StaticVarGetText("SellOrderID");
BuyPending = ibc.IsOrderPending(BuyOrderID);
SellPending = ibc.IsOrderPending(SellOrderID);
IBPosSize = ibc.GetPositionSize( Name() );
BuyStatus = ibc.GetStatus( BuyORderID, True );
SellStatus = ibc.GetStatus( SellORderID, True);
if( BuyTrigger )
{
if( LastTrade == "Sell" OR LastTrade == "" )
{
if( SellStatus == "Filled" OR SellStatus == "" )
{
BuyOrderID= ibc.ModifyOrder( BuyOrderID, Name(), "Buy", 100, "MKT", 0, 0, "Day", Transmit);
StaticVarSetText("BuyOrderID",BuyOrderID);
StaticVarSetText("LastTrade", "Buy");
SetChartBkColor( colorBrightGreen ) ;
}
}
}
else if( SellTrigger )
{
if( LastTrade == "Buy" OR LastTrade == "" )
{
if( BuyStatus == "Filled" OR BuyStatus == "" )
{
SellORderID = ibc.ModifyOrder( SellORderID , Name(), "Sell", 100, "MKT", 0, 0, "Day", Transmit);
StaticVarSetText("SellOrderID",SellOrderID);
StaticVarSetText("LastTrade", "Sell");
SetChartBkColor( colorRed ) ;
}
}
}
else if( Reset )
{
StaticVarSetText("BuyOrderID","");
if( BuyPending ) ibc.CancelOrder( BuyOrderID );
StaticVarSetText("SellOrderID","");
if( SellPending ) ibc.CancelOrder( SellOrderID );
StaticVarSetText("LastTrade", "");
ibc.CloseAllOpenPositions();
}
LastTWSMsg = ibc.getLastError( 0 );
//BuyStatus = WriteIf( BuyPending, BuyOrderID+", Status: "+BuyStatus,"");
//SellStatus= WriteIf( SellPending, SellOrderID+", Status: "+SellStatus,"");
Title = "\n"+
"Last TWS Error Msg: "+LastTWSMsg+"\n"+
" BuyOrderID: "+BuyOrderID+" "+BuyStatus+"\n"+
" SellOrderID: "+SellOrderID+" "+SellStatus+"\n"+
" Last Trade: "+LastTrade+"\n"+
" TWS Position Size: "+NumToStr(IBPosSize,1.0,False);
Plot(C,"Close",colorBlack,styleBar);
Edited by Al Venosa

 Filed by Herman at 11:04 am under Real-Time AFL Programming