February 28, 2008
Pattern Recognition Across Timeframes
TEMPORARY DRAFT
Two classical bullish patterns in daily bars.
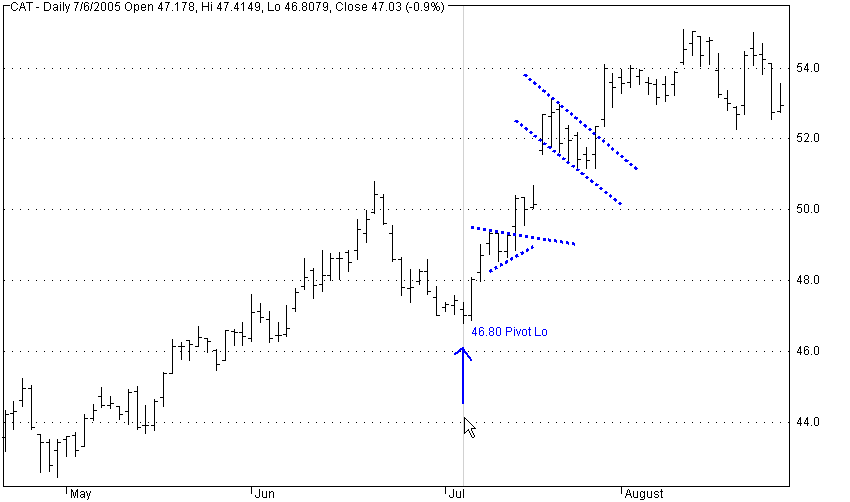
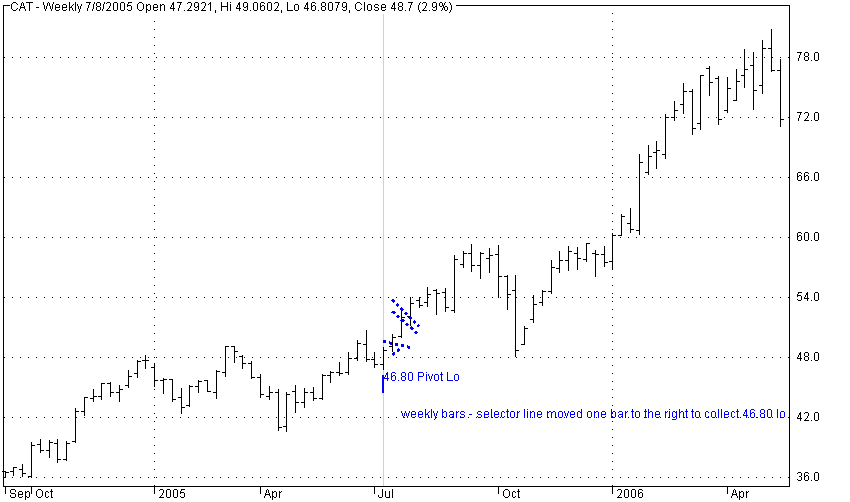
Timeframe shifted to weekly.
Selector line moved to highlight the former Pivot Lo value.
Timeframe shifted to Monthly.
Selector line moved to highlight the former Pivot Lo value.
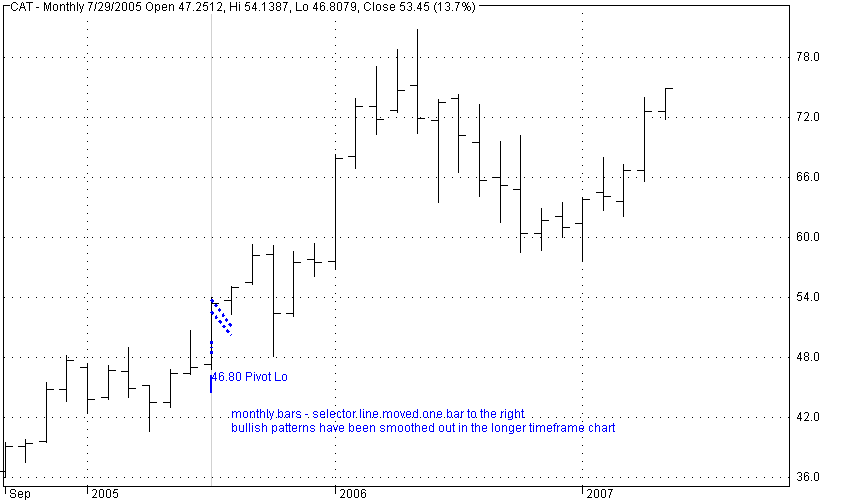
Note that the 2nd and third Pivot Lo’s (not marked on the charts) are not significant in the monthly timeframe i.e. the monthly chart does not truly represent the underlying waves (cycles) of the daily chart (which I claim is the natural rhythm of the market notwithstanding that the intra-day charts tell us as much, if not more, about the behaviour of market participants).
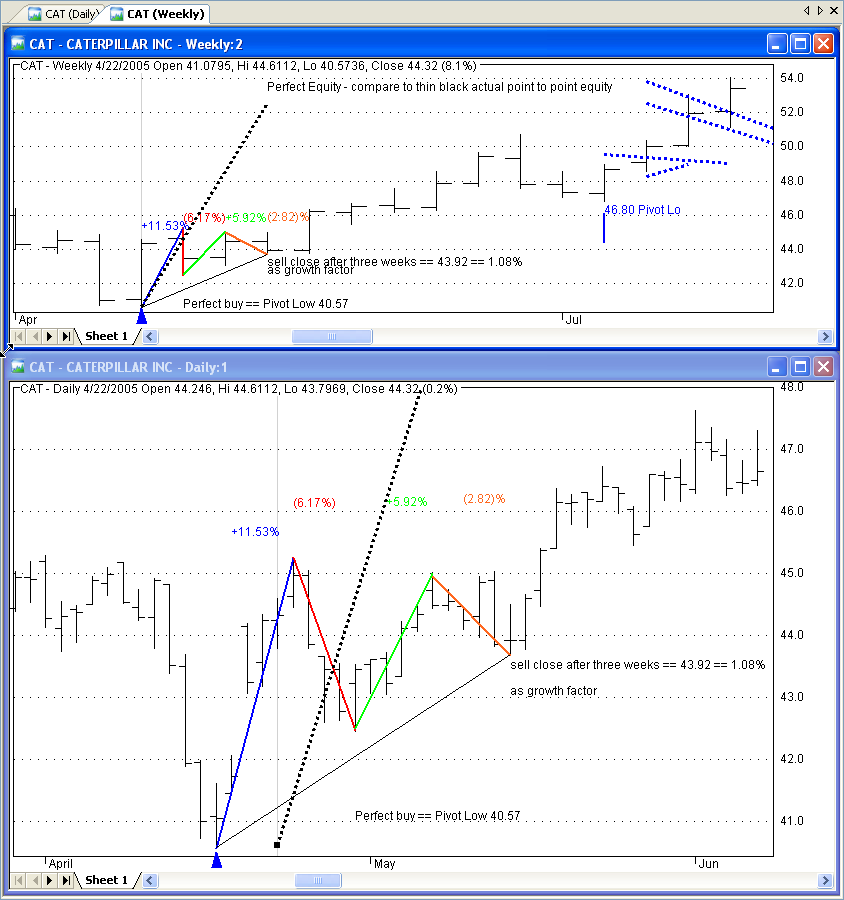
Bonus Commentary
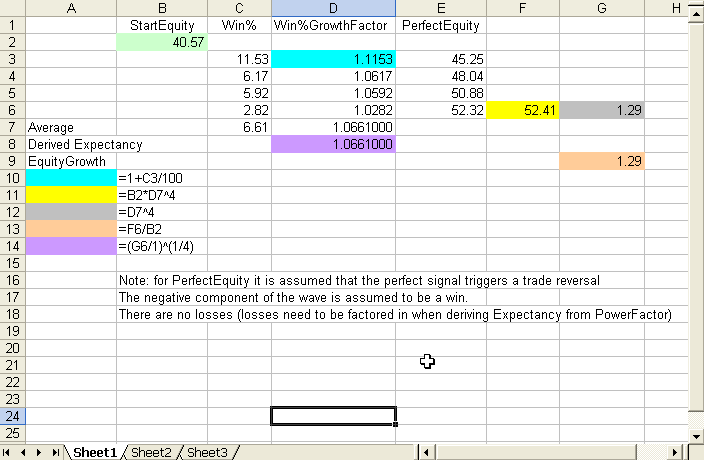
Comparing perfect equity with a buy&hold strategy for three weeks (using an earlier section of the above chart).
The charts are linked and in different timeframes.
Perfect trades are an approximation of Pivot Hi to Pivot Lo marked in colour with corresponding % change obtained via the AB studies tooltips.
For the sake of the exercise I cheated a little on the perfect swings.
For convenience I ignored inside and outside days (not counted as a swing) -annoying little things those ID’s and OD’s – messing up my perfect theories like that.
 Filed by brian_z at 1:50 am under Uncategorized
Comments Off on Pattern Recognition Across Timeframes