February 21, 2009
Plotting trades on chart
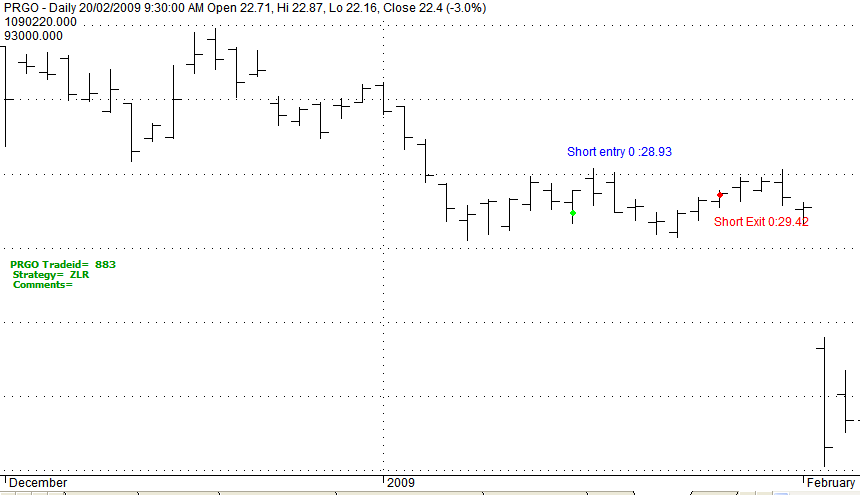
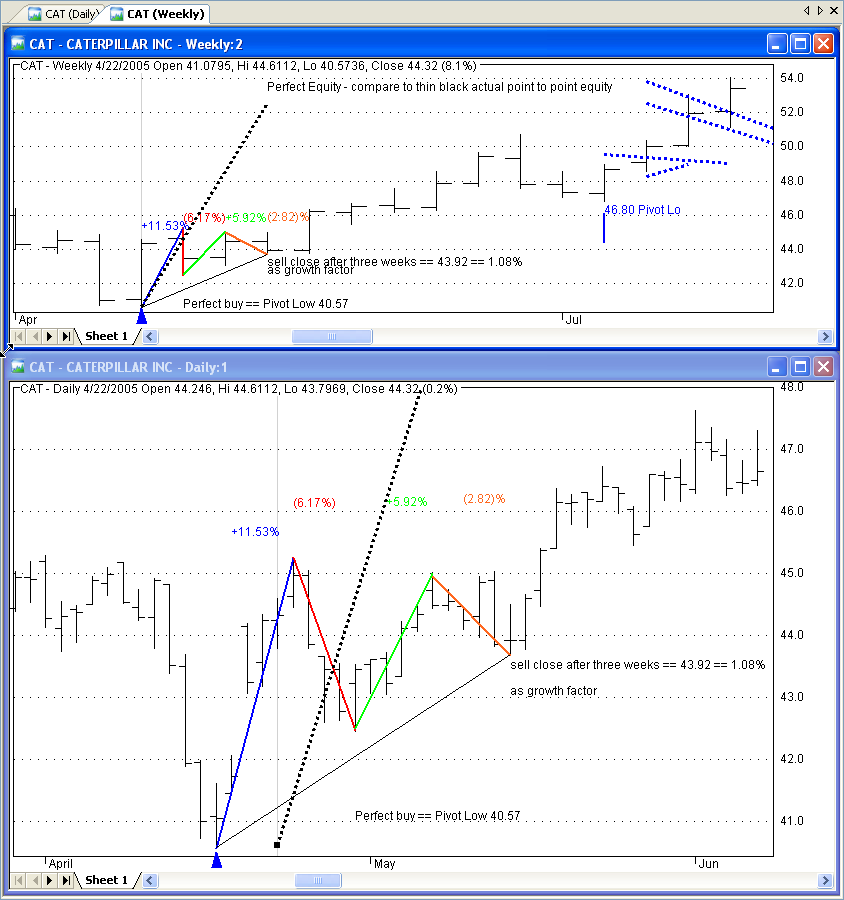
the objective is to plot trades on chart so that it can be revieweed periodically to learn to trade better. the objective
- is to produce a generic afl that will take in the symbol, trade dates and prices and plot on a chart.
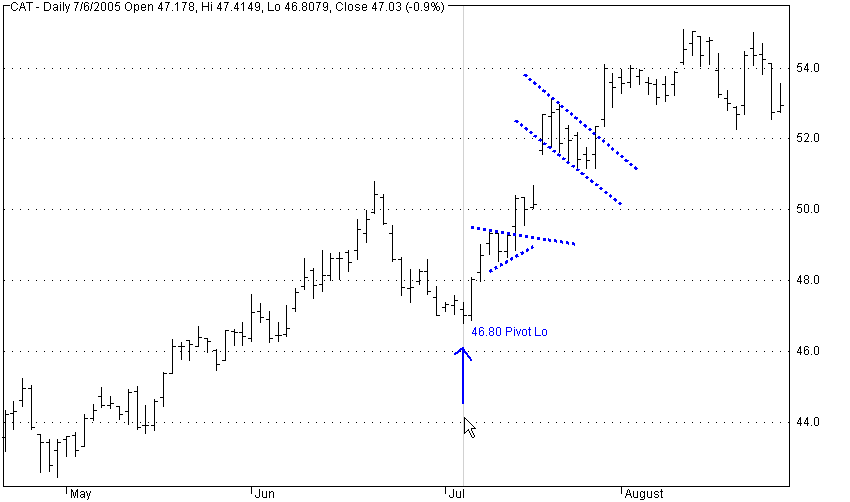
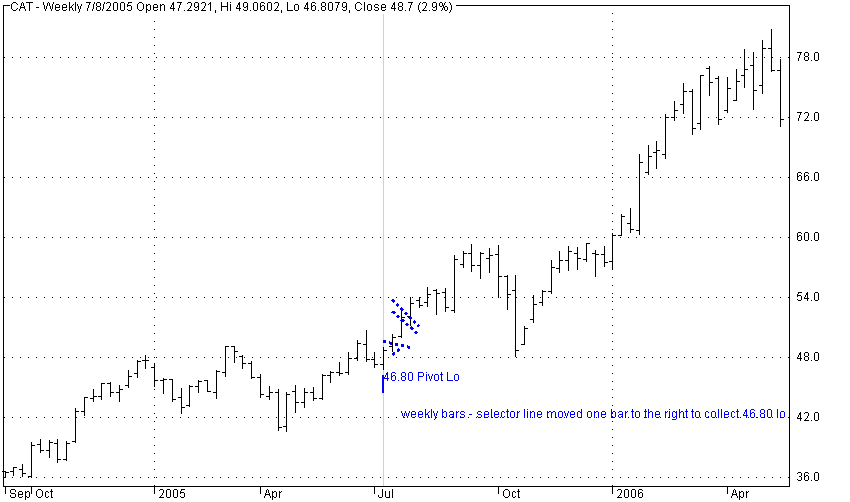
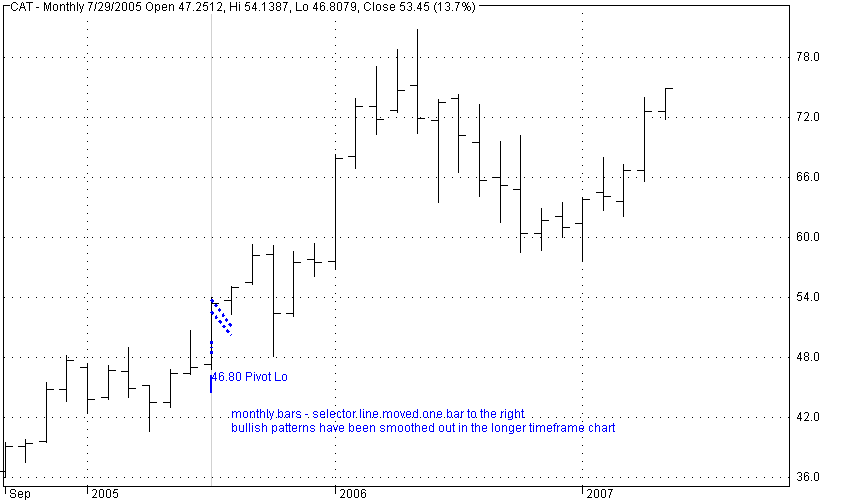
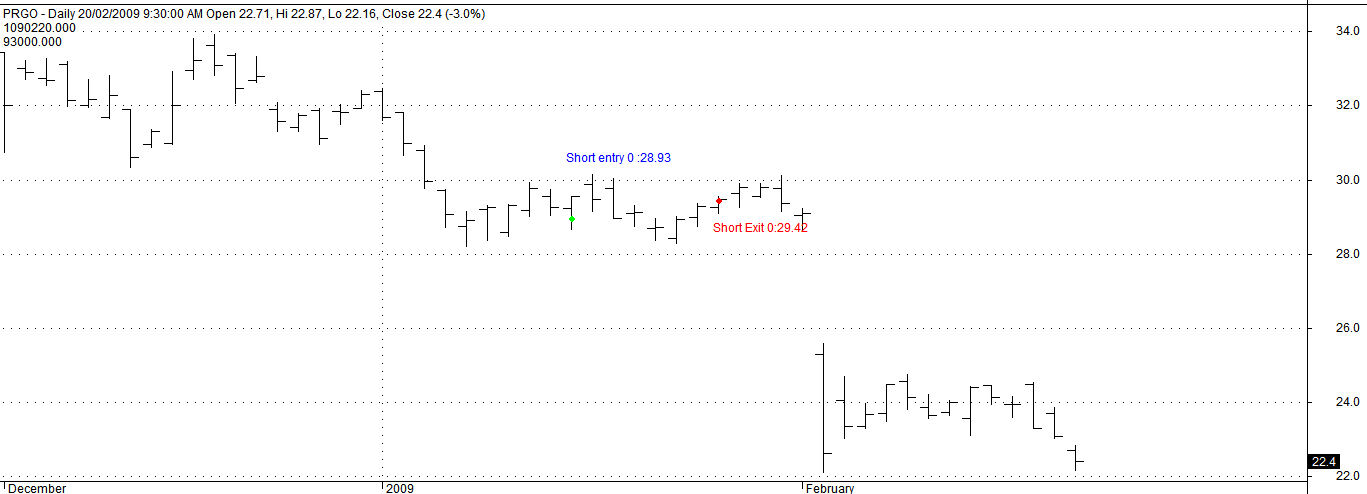
- support different timeframes so the plotting is still visible. daily, weekly, intraday, 5 minute/15 minute
- ability to support position scaling as there may be multiple trade entries /exits
this afl needs the input in terms of static variables as follows. so you may need an adapter that will take your trades and put it to afl.
// defines if it is a stock or forex.

StaticVarSetText( "TradeType" , "Stocks" ); //Stocks|Forex

// defines the forex symbol

StaticVarSetText( "forexSymbol" , "SBUX" ); //"EUR.USD-IDEALPRO-CASH|

// defines the stock symbol

StaticVarSetText( "StockSymbol", "SBUX" ); // "YHOO"

// long or short trade.

StaticVarSetText( "ShortOrLong" , "Long" ); //"Short|Long"

// entry prices

StaticVarSetText( "EntryPrice" , "14.5,15.5" );

// exit prices

StaticVarSetText( "ExitPrice" , "14.3" );

// entry date in date number comma delimited

StaticVarSetText( "EntryDate" , "1080717,1080723" );

// exit date in date number. comma delimited

StaticVarSetText( "ExitDate", "1080725" );

// entry time in time number comma delimited

StaticVarSetText( "EntryTime", "142500,120000" );

// exit time in time number comma delimited

StaticVarSetText( "ExitTime" , "110500" );

// trade id. its an internal key for me

StaticVarSetText( "Tradeid" , "4" );

// trade strategy.

StaticVarSetText( "TradeStrategy" , "fsdfdsfds" );

// any comments on trade

StaticVarSetText( "TradeComments" , "this is the comment" );

/* sets no of entries so that the code loops when printing the number

of trdes.

if 1, then ther should be only 1 entry date/time

if there are more thatn 1 entry or exits, the number of comma delimited entries exits should match the static variable NoOfEntries and same applies for exits

*/

StaticVarSet( "NoOfEntries" , 2 );

//same as above.

StaticVarSet( "NoOfExits" , 1 );
SetChartOptions( 0, chartShowArrows | chartShowDates );

_N( Title = StrFormat( “{{NAME}} – {{INTERVAL}} {{DATE}} Open %g, Hi %g, Lo %g, Close %g (%.1f%%) {{VALUES}}”, O, H, L, C, SelectedValue( ROC( C, 1 ) ) ) );

Title = Title + “\n” + NumToStr( DateNum() );

Title = Title + “\n” + NumToStr( TimeNum() );

Plot( C, “Close”, ParamColor( “Color”, colorBlack ), styleNoTitle | ParamStyle( “Style” ) | GetPriceStyle() );

//_TRACE(“ABTest: test trace1 “);
//#include “C:\Program Files\AmiBroker\sharedLibrary\DateTimeToNumber.afl”
/*
#include “C:\Program Files\AmiBroker\sharedLibrary\DateTimeToNumber.afl”
StaticVarSetText( “TradeType” ,”Stocks”); //Stocks|Forex
StaticVarSetText( “forexSymbol” ,”AAPL”); //”EUR.USD-IDEALPRO-CASH|
StaticVarSetText( “StockSymbol”,”AAPL”); // “YHOO”
StaticVarSetText( “ShortOrLong” ,”Short”); //”Short|Long”
StaticVarSet( “EntryPrice” ,163.52000);
StaticVarSet( “ExitPrice” ,148.18000);
StaticVarSet( “EntryDate” ,Date_To_Num(“20080721”));
StaticVarSet( “ExitDate” ,Date_To_Num(“20080721”));
StaticVarSet( “EntryTime”,Time_To_Num(“11:01:47”) );
StaticVarSet( “ExitTime” ,Time_To_Num(“17:52:17”));
StaticVarSetText( “TradeType” , “Stocks” ); //Stocks|Forex
StaticVarSetText( “forexSymbol” , “SBUX” ); //”EUR.USD-IDEALPRO-CASH|
StaticVarSetText( “StockSymbol”, “SBUX” ); // “YHOO”
StaticVarSetText( “ShortOrLong” , “Long” ); //”Short|Long”
StaticVarSetText( “EntryPrice” , “14.5,15.5” );
StaticVarSetText( “ExitPrice” , “14.3” );
StaticVarSetText( “EntryDate” , “1080717,1080723” );
StaticVarSetText( “ExitDate”, “1080725” );
StaticVarSetText( “EntryTime”, “142500,120000” );
StaticVarSetText( “ExitTime” , “110500” );
StaticVarSetText( “Tradeid” , “4” );
StaticVarSetText( “TradeStrategy” , “fsdfdsfds” );
StaticVarSetText( “TradeComments” , “this is the comment” );
StaticVarSet( “NoOfEntries” , 2 );
StaticVarSet( “NoOfExits” , 1 );
*/
function returnBarIndex( array )
{
indx = -1;
for ( i = 1; i < BarCount;i++ )
{
if ( array[i] == True )
{
indx = i;
}
}
return indx;
}
function returnShiftedArray( array, shift )
{
newArray = array;
for ( i = 1; i = 0 ) && ( ( shift + i ) < BarCount ) )
{
newArray[shift+i] = True;
newArray[i] = False;
}
}
return newArray;
}
if ( StrToUpper( Name() ) == StrToUpper( StaticVarGetText( “forexSymbol” ) ) OR ( StrToUpper( Name() ) == StrToUpper( StaticVarGetText( “StockSymbol” ) ) ) )
{
// get the static variables
TradeType = StaticVarGetText( “TradeType” );
forexSymbol = StaticVarGetText( “forexSymbol” );
StockSymbol = StaticVarGetText( “StockSymbol” );
ShortOrLong = StaticVarGetText( “ShortOrLong” );
if ( TradeType == “Stocks” )
{
stockname = stockSymbol;
SetOption( “FuturesMode”, False );
}
else
{
stockname = forexSymbol;
SetOption( “FuturesMode”, True );
}
for ( i = 0 ;i < StaticVarGet( “NoOfEntries” ) ;i++ )
{
VarSet( “EntryDate” + ( i ), StrToNum( StrExtract( StaticVarGetText( “EntryDate” ), ( i ) ) ) );
VarSet( “EntryPrice” + ( i ), StrToNum( StrExtract( StaticVarGetText( “EntryPrice” ), ( i ) ) ) );
VarSet( “EntryTime” + ( i ), StrToNum( StrExtract( StaticVarGetText( “EntryTime” ), ( i ) ) ) );
_TRACE( “ABTest: test 182 ” + “EntryDate” + ( i ) + NumToStr( VarGet( “EntryDate” + ( i ) ) ) );
_TRACE( “ABTest: test 182 ” + “EntryDate” + ( i ) + “string” + StrExtract( StaticVarGetText( “EntryDate” ), ( i ) ) );
}
// TESTING IF THE VARIABLES EXIST
for ( i = 0 ;i < StaticVarGet( “NoOfEntries” ) ;i++ )
{
_TRACE( “ABTest: test 182 TESTING” + “EntryDate” + ( i ) + NumToStr( VarGet( “EntryDate” + ( i ) ) ) );
_TRACE( “ABTest: test 182 TESTING timeframe” + inWeekly );
}
for ( j = 0 ;j < StaticVarGet( “NoOfExits” ) ;j++ )
{
VarSet( “ExitDate” + ( j ), StrToNum( StrExtract( StaticVarGetText( “ExitDate” ), ( j ) ) ) );
VarSet( “ExitTime” + ( j ), StrToNum( StrExtract( StaticVarGetText( “ExitTime” ), ( j ) ) ) );
VarSet( “ExitPrice” + ( j ), StrToNum( StrExtract( StaticVarGetText( “ExitPrice” ), ( j ) ) ) );
// _TRACE( “ABTest: test 182 ” + “ExitDate” + ( j ) + “string” + StrExtract( StaticVarGetText( “ExitDate” ), ( j ) ) );
}
//Buy = Sell = Short = Cover = entryPrices = exitPrices = False;
// if the symbol matches what i am looking for
dn = DateNum();
tn = TimeNum();
entryPrices = exitPrices = Buy = Sell = Short = Cover = False;
range = H – L;
switch ( Interval() )
{
// START OF SWITCH.
case inDaily:
for ( b = 0;b < BarCount;b++ )
{
// START OF DAILY
for ( i = 0 ;i dn[b] – 1 ) AND ( VarGet( “EntryDate” + i ) < dn[b] + 1 ) )
{
entryPrices[b] = VarGet( “EntryPrice” + i );
Buy[b] = Short[b] = True;
//_TRACE( “ABTest: test 182 matching price ” + NumToStr( VarGet( “EntryPrice” + i ) ) ) ;
PlotText( StaticVarGetText( “ShortOrLong” ) + ” entry ” + i + ” ” + “:” + entryPrices[b] , b, High[b] + range[b], colorBlue );
// PlotText( “entry” + VarGet( “EntryPrice” + i ) , b, EntryPrice0, colorBlue );
// _TRACE( “ABTest: test 182 MATCHED ” + NumToStr( VarGet( “EntryDate” + i ) ) + NumToStr( dn[b] ) );
}
for ( j = 0 ;j dn[b] – 1 ) AND ( VarGet( “ExitDate” + j ) < dn[b] + 1 ) )
{
exitPrices[b] = VarGet( “ExitPrice” + j );
Sell[b] = Cover[b] = True;
PlotText( StaticVarGetText( “ShortOrLong” ) + ” Exit ” + j + “:” + VarGet( “ExitPrice” + j ) , b, Low[b] – range[b], colorRed );
// _TRACE( “ABTest: test 182 MATCHED ” + NumToStr( VarGet( “ExitPrice” + j ) ) + NumToStr( dn[b] ) + NumToStr( VarGet( “ExitDate” + j )));
}
}
}
} // START OF DAILY
break;
case inWeekly:
for ( b = 1;b < BarCount – 1;b++ )
{
// START OF weekly
for ( i = 0 ;i 0)
PreviousBar=b-1;
NextBar=b;
if(b= dn[b] ) AND ( VarGet( “EntryDate” + i ) < dn[b+1] ) )
{
entryPrices[b] = VarGet( “EntryPrice” + i );
Buy[b] = Short[b] = True;
_TRACE( “ABTest: test 182 matching price entry ” + NumToStr( VarGet( “EntryPrice” + i ) ) ) ;
PlotText( StaticVarGetText( “ShortOrLong” ) + ” entry” + i + ” ” + “:” + entryPrices[b] , b, High[b] + range[b], colorBlue );
// PlotText( “entry” + VarGet( “EntryPrice” + i ) , b, EntryPrice0, colorBlue );
// //( “ABTest: test 182 MATCHED ” + NumToStr( VarGet( “EntryDate” + i ) ) + NumToStr( dn[b] ) );
}
for ( j = 0 ;j = dn[b-1] ) AND (VarGet( “EntryDate” + i )= dn[b] ) AND ( VarGet( “ExitDate” + j ) < dn[b+1] ) )
{
exitPrices[b] = VarGet( “ExitPrice” + j );
Sell[b] = Cover[b] = True;
PlotText( StaticVarGetText( “ShortOrLong” ) + ” Exit” + j + “:” + VarGet( “ExitPrice” + j ) , b, Low[b] – range[b], colorRed );
// _TRACE( “ABTest: test 182 MATCHED ” + NumToStr( VarGet( “ExitPrice” + j ) ) + NumToStr( dn[b] ) + NumToStr( VarGet( “ExitDate” + j )));
}
}
}
} // START OF weekly
break;
//_TRACE(“ABTest: test 182 ” +”getting to break”);
case in1Minute:
case in5Minute:
case in15Minute:
case inHourly:
for ( b = 1;b < BarCount – 1;b++ )
{
// START OF intraday
for ( i = 0 ;i = tn[b] ) AND ( VarGet( “EntryTime” + i ) < tn[b+1] ) )
{
entryPrices[b] = VarGet( “EntryPrice” + i );
Buy[b] = Short[b] = True;
_TRACE( “ABTest: test 182 matching price entry ” + NumToStr( VarGet( “EntryPrice” + i ) ) ) ;
PlotText( StaticVarGetText( “ShortOrLong” ) + ” entry” + i + ” ” + “:” + entryPrices[b] , b, High[b] + range[b], colorBlue );
// PlotText( “entry” + VarGet( “EntryPrice” + i ) , b, EntryPrice0, colorBlue );
// //( “ABTest: test 182 MATCHED ” + NumToStr( VarGet( “EntryDate” + i ) ) + NumToStr( dn[b] ) );
}
for ( j = 0 ;j = dn[b-1] ) AND (VarGet( “EntryDate” + i )= tn[b] ) AND ( VarGet( “ExitTime” + j ) < tn[b+1] ) )
{
exitPrices[b] = VarGet( “ExitPrice” + j );
Sell[b] = Cover[b] = True;
PlotText( StaticVarGetText( “ShortOrLong” ) + ” Exit” + j + “:” + VarGet( “ExitPrice” + j ) , b, Low[b] – range[b], colorRed );
// _TRACE( “ABTest: test 182 MATCHED ” + NumToStr( VarGet( “ExitPrice” + j ) ) + NumToStr( dn[b] ) + NumToStr( VarGet( “ExitDate” + j )));
}
}
}
} // end of intraday
break;
//_TRACE(“ABTest: test 182 ” +”getting to break”);
}// end of switch.
PlotShapes( IIf( Buy OR Short, shapeSmallCircle, shapeNone ), colorBrightGreen, 0, EntryPrices, 0 );
PlotShapes( IIf( Sell OR Cover, shapeSmallCircle, shapeNone ), colorRed, 0 , ExitPrices, 0 );
Miny = Status( “axisminy” );
Maxy = Status( “axismaxy” );
pxheight = Status( “pxheight” );
y = ( GetCursorYPosition() – Miny ) / ( Maxy – Miny );
y = ( 1 – y ) * pxheight;
y = y – 20;
x = 10;
GfxSelectPen( colorRed, 1 );
GfxSelectSolidBrush( colorCustom1 );
//GfxRectangle( 2, y-100, 270, y ) ;
GfxSelectFont( “Tahoma”, 8, 700 );
GfxSetBkMode( 1 );
GfxSetTextColor( colorGreen );
GfxTextOut( Name() + ” Tradeid= ” + StaticVarGetText( “Tradeid” ) , x, y ) ;
GfxTextOut( ” Strategy= ” + StaticVarGetText( “TradeStrategy” ) , x, y + 10 ) ;
GfxTextOut( ” Comments= ” + StaticVarGetText( “TradeComments” ) , x, y + 20 ) ;
} // // if the symbol matches what i am looking for
 Filed by Tomasz Janeczko at 7:57 pm under AmiBroker Tools and Features,Uncategorized
Comments Off on Plotting trades on chart