Equalize X-Range for all windows

This function was requested on the main list, and was solved with the help of several expert programmers from the list. Thanks guys!

This function can be copied to an include file that is included in each program from which you might want to synchronize the datetime range for all visible windows. The function places a small [R] button at the right top of your chart. Clicking this button will set the datetime ranges of all windows equal to the one you click the button in. Note that this window has to be active for the button to work, i.e., if the window was not active (selected) it will require two clicks for the button to respond.

function RangeAllWindows()
{
    MX GetCursorXPosition);
    MY GetCursorYPosition);
    LeftClick GetCursorMouseButtons() == 9;

    // Place Ranging Button
    ButtonSize=20;
    X2 Status"pxchartright" )+1;
    X1 X2 ButtonSize;
    Y1 0;
    Y2 Y1 ButtonSize;
    GfxSelectFont"Tahoma"ButtonSize 1.5800 );
    GfxSelectPencolorBlack );
    GfxSelectSolidBrushcolorYellow );
    GfxRectangleX1Y1X2Y2 );
    GfxSetTextColorcolorBlack );
    GfxSetBkMode);
    GfxDrawText"R"X1Y1X2Y241 );
    OnButton MX >= X1 AND MY >= Y1 AND MX <= X2 AND MY <= Y2;

    if ( OnButton AND LeftClick )
    {
        DT DateTime();
        BI BarIndex();
        FirstBarIndex Status"firstvisiblebarindex" );
        LastBarIndex Status"lastvisiblebarindex" );
        FirstDateTime LastValueValueWhenFirstBarIndex == BIDT ) );
        LastDateTime LastValueValueWhenLastBarIndex == BIDT ) );
        FirstDateTimestr DateTimeToStrFirstDateTime );
        LastDateTimestr DateTimeToStrLastDateTime );
        AB CreateObject"Broker.Application" );
        docs AB.Documents;
        Qty docs.Count;

        for ( 0Qtyi++ ) // Range all windows
        {
            doc docs.Item);
            AW doc.ActiveWindow;
            AW.Activate();
            AW.ZoomToRangeFirstDateTimestrLastDateTimestr );
            // correct shift due to blank bars
            WSHShell CreateObject"WScript.Shell" );
            WSHShell.AppActivate"AmiBroker" );
            WSHShell.Sendkeys"{PGDN}" );
        }
    }
}

//Demo Code
RangeAllWindows();
Plot(C,"",1,128);

Date and Time to Number Conversions

Code developed and kindly donated by Murthy Suresh.

{
    dd_ StrToNumStrRightaaaammdd) );    //printf(WriteVal(dd_) + " "  );
    mm_ StrToNumStrMidaaaammdd4) );    //printf(WriteVal(mm_) + " "  );
    aa_ StrToNumStrLeftaaaammdd) );    //printf(WriteVal(aa_) + " " + "\n" );
    Date_Num = ( 10000 * ( aa_ 1900 ) ) + ( 100 mm_ ) + dd_;
    RESULT Date_Num;
    return RESULT;
}

function Time_To_NumstrTime // format for time is hh:mm:ss
{
    /*
    //do something to raise alert  if length does not match
    ????PopupWindow("Current time is: " + Now(),"Alert", 2,
    640*mtRandom(), 480*mtRandom());
    */
    hh_t StrToNumStrLeftstrTime) );    //printf(WriteVal( hh_t ) + " "  );
    mm_t StrToNumStrMidstrTime3) );    //printf(WriteVal( mm_t ) + " "  );
    ss_t StrToNumStrRightstrTime) );    //printf(WriteVal( ss_t ) + " "  + "\n"  );
    Time_Num 10000 hh_t 100 mm_t ss_t;
    RESULT Time_Num;
    return RESULT;

Popup Window: Preventing pile-ups

By Dennis Brown

The popup window is a great tool in debugging and can help you to keep track of what your code is doing or it can be used to alert you to special situations in your normally running formula. A common problem is that if you call PopupWindow() from a loop or if one gets generated on every AFL pass, you can get hundreds or even thousands of pop-ups piling up on your screen. Tomasz posted a simple work-around on the AmiBroker Feedback Center that took care of the problem in some cases (Suggestion 1528):

The following is a more complete version of this solution that adds a popupID to keep track of each individual popup window and re-enable the popup after its specified timeout period, or if any of the displayed text changes:

function GetSecondNum()
{
    Time Now);
    Seconds intTime 100 );
    Minutes intTime 100 100 );
    Hours intTime 10000 100 );
    SecondNum intHours 60 60 Minutes 60 Seconds );
    return SecondNum;
}

function PopupWindowExpopupIDbodytextcaptiontexttimeoutlefttop )
{
    displayText bodytext captiontext;
    if ( ( StaticVarGetText"prevPopup" popupID ) != displayText) OR ( StaticVarGet"prevPopupTime" popupID ) < GetSecondNum() ) )
    {
        StaticVarSetText"prevPopup" popupIDdisplayText);
        StaticVarSet"prevPopupTime" popupIDGetSecondNum() + timeout );
        PopupWindowbodytextCaptiontext popupIDtimeoutLefttop );
    }
}

PopupWindowEx"ID:1""testing""test alert "5, -1, -);
PopupWindowEx"ID:2""testing""test alert "50);

Restore Last Used Range v2

When starting up AmiBroker the chart range defaults to the last number of bars set in Preferences. This means that in virtually all cases you have to manually zoom and restore the chart range you were previously working with. This post presents a function that will restore the last used range before you shut down AmiBroker. If you like to use this function routinely, you can copy the functions below to your default #Include file and place this call at the top of your code:

<p>RestoreLastUsedRange();</p>

This function checks the contents of a static variable named “StartUp”+ChartIDStr. This static variable will return a NULL the first time it is called. When this happens, the ZoomToIndex() is called. This function retrieves the last used range for the current chartID from your hard disk and zooms to this range. The Plot() and Title statements are added to help you verify proper operation. You can also uncomment the two _TRACE() commands and start up DebugView for further diagnostic purposes.

If you do not have it yet, be sure to create a folder for the PersistentVariables, as shown at the top of the code. This is where the First and Last Indexes, which point to the start and end of the range being restored, are saved in a small file. You can open these with Notepad to help debugging operations.

//Pay attention to the double slashes in the path line. They need to be there.

// This creates the folder for PersistentPath variables if it doesn't exist
PersistentPath StaticVarGetText"~PersistentPath" );

if ( PersistentPath == "" // Ensures this folder exists
{
    PersistentPath "PersistentVariables\\";
    fmkdirPersistentPath );
    StaticVarSetText"~PersistentPath"PersistentPath );
}

function PersistentVarGetVarName )

{
    global PersistentPath;
    fh fopenPersistentPath VarName ".pva""r" );

    if ( fh )
    {
        String fgetsfh );
        fclosefh );
    }
    else
        string "";

    Number StrToNum( String );

    return Number;
}

function PersistentVarSetVarNameNumber )
{
    global PersistentPath;
    String NumToStrNumber1.3False );
    fh fopenPersistentPath VarName ".pva""w" );

    if ( fh )
    {
        fputsStringfh );
        fclosefh );
    }

    return fh;
}

procedure ZoomToIndexFirstBarIndexLastBarIndex )
{
    DT DateTime();
    BI BarIndex();
    FirstDateTime LastValueValueWhenFirstBarIndex == BIDT ) );
    LastDateTime LastValueValueWhenLastBarIndex == BIDT ) );

    FirstDateTimestr DateTimeToStrFirstDateTime );
    LastDateTimestr DateTimeToStrLastDateTime );

    AB CreateObject"Broker.Application" );
    AW AB.ActiveWindow;
    AW.ZoomToRangeFirstDateTimestrLastDateTimestr );
    //_TRACE( FirstDateTimestr +", "+LastDateTimestr );
}

function RestoreLastUsedRange()
{
    if ( Status"Action" ) == // Only perform ranging in an indicator
    {
        // is this a "start-up execution?
        ChartIDStr NumToStrGetChartID(), 1.0False );
        PrevFirstBarIndex PersistentVarGet"FirstBarIndex" ChartIDStr ); // Recall last positions
        PrevLastBarIndex PersistentVarGet"LastBarIndex" ChartIDStr );

        if ( IsNullStaticVarGet"StartUp" ChartIDStr ) ) )
        {
            ZoomToIndexPrevFirstBarIndexPrevLastBarIndex );
            StaticVarSet"StartUp" ChartIDStrTrue );
            //_TRACE( "# StartUp Zoom: CHARTID: " + ChartIDStr + ", PrevFirstBI: " + PrevFirstBarIndex + ", PrevLastBI: " + PrevLastBarIndex );
        }

        // Update zoom range on disk
        FirstBarIndex Status"firstvisiblebarindex" );

        LastBarIndex Status"lastvisiblebarindex" );

        if ( PrevFirstBarIndex != FirstBarIndex OR PrevLastBarIndex != LastBarIndex )
        {
            PersistentVarSet"FirstBarIndex" ChartIDStrFirstBarIndex );
            PersistentVarSet"LastBarIndex" ChartIDStrLastBarIndex );
            //_TRACE( "# Update Zoom Range: CHARTID: " + ChartIDStr + ", FirstBI: " + FirstBarIndex + ", LastBI: " + LastBarIndex );
        }
    }
}

_SECTION_BEGIN"RESTORE RANGE" );

if ( ParamTrigger"Clear all Static Variables""CLEAR" ) )
    StaticVarRemove"*" );

PlotC""1128 );

SetBarsRequiredsbrAllsbrAll );

RestoreLastUsedRange();

Title "\n" +
        " ChartIDStr: " NumToStrGetChartID(), 1.0False ) + "\n" +
        " FirstIndex: " Status"firstvisiblebarindex" ) + "\n" +
        "  LastIndex: " Status"Lastvisiblebarindex" ) + "\n" +
        "Selected BI: " BarIndex();
_SECTION_END();

Edited by Al Venosa.

Deleting Tickers and Composites

Creating composites is a lot of fun and can provide useful information about market and sector movements. However, when creating many composites, you will sooner or later find that your database is bloated with obsolete composites. The first requirement is to create a function to delete composites. Dingo kindly provided the following example code, which will be used to provide a variety of other useful functions. Note that the functions below can be used to delete both tickers and composites; the procedure is the same. The formula is designed to be run as an indicator but can be adapted to run in a scan, etc.

Introduction to the ATC

The AddToComposite() (ATC) is an extremely powerful function. Topics in this category will not repeat ATC topics covered elsewhere, so be sure to follow the following links for more information and applications:

The AmiBroker AFL Reference: ADDTOCOMPOSITE
Calculating multiple-security statistics with AddToComposite function
Introduction to AddToComposite
Multiple time-frame indicators
Search this users’ Knowledge Base for applications

Also be sure to browse the applications listed at the bottom of the AFL Reference for the ATC.

Zoom-to-Range Applications

This post offers a variety of zoom functions to help you analyze charts better. For example, you can zoom in on the cursor-selected bar, or you can step forward and backward from signal to signal or over custom price conditions. These functions are made possible by the ZoomToRange OLE function, which lets you zoom in on a specific date range.

To exercise and test the functions below, copy and Insert the code to an Indicator pane, open the Param window, and click on various options to see how the functions work. For demo purposes, three zoom events are provided: Buy, Sell, and Mondays. In your own application, you would assign other conditions to the event variable, such as, for example, gaps, price patterns, etc. Stepping from Event to Event would allow you to visually analyze the chart surrounding events. The Param window looks like this:
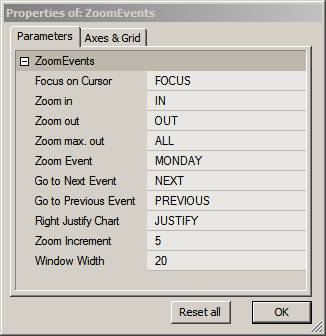
Zoom Increment is the number of bars added to the display with each zoom in/out action. WindowWidth is the number of bars displayed when jumping from event to event.
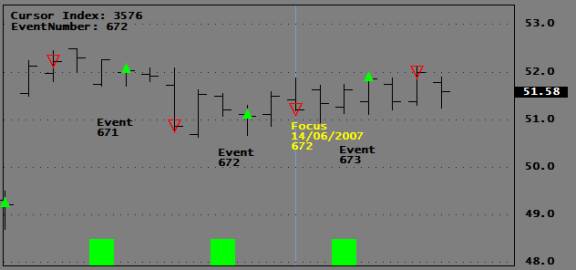
The program uses a FocusBar to which zoom dimensions are referenced. Yellow text is attached to the FocusBar on the chart to identify it. You can add other information to this PlotText(). For example, if you were analyzing buy, sell, short, and cover signals, you could add trade prices and indicator values, if you so desired. The Green histogram at the bottom of the chart indicates where the selected events occur. See an example chart below showing buy signals. The green histogram bar occurs just before the green buy arrow on the chart.
Descriptions for the function below are presented ahead of the functions themselves so that you can copy all the code in one step.

ZoomToIndex( FirstBarIndex, LastBarIndex)
Calling the ZoomToIndex() will zoom your chart to display a window ranging from the first argument (FirstBarIndex) to the second argument (LastBarIndex). While you cannot zoom in closer than ten bars using the Zoom In/Out buttons on your AB Toolbar, this function lets you zoom all the way down to a two-bar window. Since most Indicators use periods expressed in bars and not in dates, the function uses the BarIndex to set the window width.

ZoomToCursor( ZoomWidth )
This function lets you zoom in to the cursor position and display the number of bars assigned to ZoomWidth. The values of important variables are displayed in the chart Title for educational purposes.

ZoomOut( ZoomWidth )
This function zooms out by increasing the number of bars displayed by ZoomWidth bars.

ZoomIn( ZoomWidth )
This function zooms in by reducing the number of bars displayed by ZoomWidth bars.

ZoomToNext( Event, ZoomWidth )
This function lets you jump to the next occurrence of a TRUE value in the Event Array. It also focuses on the event with a window of ZoomWidth bars. The most important application for this function would probably be to analyze trades by stepping from signal to signal and to visually inspect custom events or price patterns.

ZoomToPrev( Event, ZoomWidth )

This function is similar to the one above, but it jumps (retreats) to the previous event.

MarkFocus()
This function places the Yellow text at the FocusBar. You may want to customize the text displayed.

ZoomAllOut()
This function zooms out to display all bars in the database.

RightJustifyChart
When trading Real-Time, your signals are generated by prices from the Last Bar whether this bar is visible or not. If, during intense trading, you miss the fact that your Chart is not fully right justified, you may see and hear orders going out while no actions show on your Chart. While such confusion usually doesn’t last long, it could delay discretionary trades and even trick you into thinking there may be a coding problem, causing you to initiate debugging code. This function right-justifies your chart, and if it is triggered at the start of your session, it will prevent you from working with a shifted chart.

procedure ZoomToIndexFirstBarIndexLastBarIndex)
{
StaticVarSet("FirstBarIndex",FirstBarIndex);
StaticVarSet("LastBarIndex",LastBarIndex);
DT DateTime();
BI BarIndex();
LastDateTime LastValue(ValueWhenLastBarIndex == BIDT ));
FirstDateTime LastValue(ValueWhenFirstBarIndex == BIDT ));
LastDateTimestr DateTimeToStrLastDateTime );
FirstDateTimestr DateTimeToStrFirstDateTime );
AB CreateObject("Broker.Application");
AW AB.ActiveWindow;
AW.ZoomToRangeFirstDateTimestrLastDateTimestr );
} 
procedure ZoomToCursorZoomWidth )
{
local ZoomWidth;
BI BarIndex();
SBI SelectedValue(BI);
LBI LastValue(BI);
CursorIndexNz(StaticVarGet("CursorIndex"));
FirstBarIndex Max(0,SBI ZoomWidth);
LastBarIndex MinLBISBI ZoomWidth );
ZoomToIndexFirstBarIndexLastBarIndex);
} 
procedure ZoomOutZoomWidth )
{
local ZoomWidth;
BI BarIndex();
LBI LastValue(BI);
LastVisiblebar Status("LastVisibleBar");
FirstVisibleBarStatus("FirstVisibleBar");
FirstBarIndex Max0FirstVisibleBar ZoomWidth);
LastBarIndex MinLBILastVisibleBar ZoomWidth );
ZoomToIndexFirstBarIndexLastBarIndex);
} 
procedure ZoomInZoomWidth )
{
local ZoomWidth;
_TRACE("##");
BI BarIndex();
LBI LastValue(BI);
LastVisiblebar Status("LastVisibleBar");
FirstVisibleBarStatus("FirstVisibleBar");
FirstBarIndex Max0FirstVisibleBar ZoomWidth);
LastBarIndex MinLBILastVisibleBar ZoomWidth );
ZoomToIndexFirstBarIndexLastBarIndex);
} 
procedure ZoomToNextEventZoomWidth )
{
local EventZoomwidth;
EventNum Cum(Event);
BI BarIndex();
LBI LastValue(BI);
DT=DateTime();
NextEventNum Min(Nz(StaticVarGet("EventNumber"))+1LastValue(EventNum));
NextEventIndex LastValue(ValueWhen(EventNum == NextEventNumBI));
StaticVarSet("EventNumber",Max(1NextEventNum));
FirstBarIndex Max0NextEventIndex ZoomWidth );
LastBarIndex MinBarCount-1NextEventIndex ZoomWidth);
ZoomToIndexFirstBarIndexLastBarIndex);
StaticVarSet("FocusIndex",NextEventIndex);
} 
procedure ZoomToPrev(  EventZoomWidth )
{
local EventZoomwidth;
EventNum Cum(Event);
BI BarIndex();
LBI LastValue(BI);
LastEventNum LastValue(EventNum);
NextEventNum Max(1,Nz(StaticVarGet("EventNumber"))-1);
NextEventIndex LastValue(ValueWhen(EventNum == NextEventNumBI,1));
StaticVarSet("EventNumber",NextEventNum);
FirstBarIndex Max0NextEventIndex ZoomWidth );
LastBarIndex MinBarCount-1NextEventIndex ZoomWidth);
ZoomToIndexFirstBarIndexLastBarIndex);
StaticVarSet("FocusIndex",NextEventIndex);
} 
procedure MarkFocus()
{
global EventNum;
DT=DateTime();
BI BarIndex();
LBI LastValue(BI);
FirstBarIndex Nz(StaticVarGet("FirstBarIndex"));
FocusIndex Min(LBI,Nz(StaticVarGet("FocusIndex"))+1);
FocusDateStr NumToStr(DT[FocusIndex],formatDateTime);
ENStr NumToStr(EventNum[FocusIndex],1.0,False);
PlotText("\n\nFocus\n"+FocusDateStr+"\n"+ENStr,FocusIndex,C[FocusIndex],colorYellow);
} 
procedure ZoomAllOut()
{
BI BarIndex();
LBI LastValue(BI);
FirstBarIndex 0;
LastBarIndex LBI;
ZoomToIndexFirstBarIndexLastBarIndex);
} 
procedure RightJustifyChartChartWidth )
{
DT DateTime();
BI BarIndex();
FirstDateTime LastValueNz(RefDT,-Max(2ChartWidth) ) ) );
FirstDateTimestr DateTimeToStrFirstDateTime );
LastDateTimestr DateTimeToStrLastValue(DT) );
AB CreateObject("Broker.Application");
AW AB.ActiveWindow;
AW.ZoomToRangeFirstDateTimestrLastDateTimestr );
} 
SetBarsRequired(1000000,1000000);
GraphXSpace 20;
_SECTION_BEGIN("ZOOM");
FocusTriggerParamTrigger("Focus on Cursor","FOCUS");// zoom out by ZoomIncrement
ZoomInTriggerParamTrigger("Zoom in","IN");// zoom in by ZoomIncrement
ZoomOutTriggerParamTrigger("Zoom out","OUT");// zoom in by ZoomIncrement
ZoomAllTrigger ParamTrigger("Zoom max. out","ALL");// zoom out to all bars
ZoomPrevTriggerParamTrigger("Go to Next Event","NEXT");// Jump to next event
ZoomNextTriggerParamTrigger("Go to Previous Event","PREVIOUS");// Jump to previous event
RJTriggerParamTrigger("Right Justify Chart","JUSTIFY");
ZoomIncrementParam("Zoom Increment",10,1,1000,2);
ZoomWidthParam("Window Width",20,2,1000,1);
_SECTION_END();
_SECTION_BEGIN("TEST SIGNALS");
ZoomEventParamList("Zoom Event","MONDAY|RSI-BUY|RSI-SELL|TARGET",1);// Test events
ProfitTargetParam("Profit Target",0.1,0,2,0.01);// Profit target
_SECTION_END(); 

PrevZoomWidthNz(StaticVarGet("ZoomWidth"));
ZoomChangePrevZoomWidth != ZoomWidthStaticVarSet("ZoomWidth",ZoomWidth); 

ZoomAction FocusTrigger OR ZoomOutTrigger OR ZoomAllTrigger OR ZoomNextTrigger OR ZoomPrevTrigger OR ZoomChange OR ZoomInTrigger OR RJTrigger; 

if( ZoomEvent == "MONDAY" Event DayOfWeek() == 1;
else if( ZoomEvent == "RSI-BUY" ) 
{ 
Event Cross(30,RSI());// Buy rule to investigate
PlotShapes(IIf(Event,shapeSmallUpTriangleshapeNone),5,0,C,0);
Sell 0; 
}
else if( ZoomEvent == "RSI-SELL" ) 
{ 
Event Cross(RSI(),70);// sell rule to investigate 
PlotShapes(IIf(Event,shapeHollowDownTriangleshapeNone),4,0,C,0);
Buy 0; 
}
else if( Zoomevent == "TARGET" ) 
{
Target Ref(C,1) - C;// Profit target to analyze
Event Target ProfitTarget;
PlotShapes(IIf(Event,shapeSmallUpTriangleshapeNone),5,0,C,0);
}
else Event 0Plot(C,"",1,128);
EventNum Cum(Event);
FVBI Status("FirstVisibleBarIndex");
LVBI Status("LastVisibleBarIndex");
BI BarIndex();
SBI SelectedValue(BI);
LBI LastValue(BI); 

FirstVisibleBar Status"FirstVisibleBar" );
Lastvisiblebar Status("LastVisibleBar");
for( FirstvisiblebarLastvisiblebar AND BarCountb++)
{
if( Event[b] ) PlotText("\n\n\n\nEvent\n"+NumToStr(EventNum[b],1.0,False),b,L[b],1);
} 

if( GetCursorMouseButtons() == ) 
{
StaticVarSet("CursorIndex",SBI);
EventNum Cum(Event);
StaticVarSet("EventNumber",SelectedValue(EventNum));
StaticVarSet("FocusIndex",SBI-1);
}
CursorIndexNz(StaticVarGet("CursorIndex")); 

if( ZoomAction )
{
CurrentRangeLastVisiblebar-FirstVisibleBar;
VisibleCenterint((LastVisibleBar FirstVisibleBar)/2);
PrevEventIndex LastValue(ValueWhen(Event,BI,1));
NextEventIndex LastValue(ValueWhen(Event,BI,-1));
FirstBarIndex Nz(StaticVarGet("FirstBarIndex"));
LastBarIndex Nz(StaticVarGet("LastBarIndex")); 

if( FocusTriggerZoomToCursorZoomWidth );
else if( ZoomInTrigger ZoomInZoomWidth );
else if( ZoomOutTrigger ZoomOutZoomWidth );
else if( ZoomNextTrigger ZoomToPrevEventZoomWidth );
else if( ZoomPrevTrigger ZoomToNextEventZoomWidth );
else if( ZoomAllTrigger ZoomAllOut();
else if( RJTrigger RightJustifyChartZoomWidth );
} 

MArkFocus(); 

Plot(Event,"",5,styleArea|styleOwnScale|styleNoLabel,0,10);
CursorIndex StaticVarGet("CursorIndex");
EventNumberStaticVarGet("EventNumber");
Title "\n"+
"Cursor Index: "+NumToStr(CursorIndex,1.0,False)+"\n"+
"EventNumber: "+NumToStr(EventNumber,1.0,False)+"\n";

Edited by Al Venosa

Plotting Trade-Lines

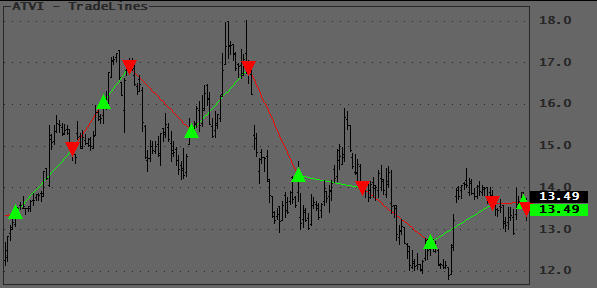
A useful application is to plot straight lines between entry- and exit-signals, giving you the ability to view at a glance the location and magnitude of profits and losses of your trading system. The LineArray() function enables you to draw straight lines from one event or condition to another. In the chart below, which shows a reversal trading system, note how the lines begin and end at the exact trade prices, green being long and red being short. This gives you a quick impression of the profitability and location of individual trades:

Chart with Trade-Lines

Other applications would be plotting of custom ZigZag lines, price channels, trendlines, breakouts, etc.

There are two afl versions listed below, since I believe many of us use the first method, I decided to show them both for educational purposes.

The first one shows how you should NOT plot LineArrays. This method calls Plot() repeatedly and plots each LineArray segment as it is calculated. This is very resource consuming (executes slow) and may trigger a Warning 502 when you display a lot of data. Do not use this version.

The second version shows how Tomasz (Thanks TJ!) combined the individual LineArray segments inside the loop and then plots them with a single Plot() statement outside the loop. This code executes much faster and will never trigger Warning 502. The technique is simple but shows a clever way to combine array segments. Study it :-) it will come in handy one day!

// This version is only listed to show you how it should NOT be programmed
// Dummy system to generate some signals
Buy CrossMACD(), Signal() );
BuyPrice Open;     // Substitute your own prices
Sell CrossSignal(), MACD() );
SellPrice Close;     // Substitute your own prices
PlotShapesIIfBuyshapeSmallUpTriangleshapeNone ), colorBrightGreen0BuyPrice);
PlotShapesIIfSellshapeSmallDownTriangleshapeNone ), colorRed0SellPrice);
PlotC""1128 );
// Plot the Trade Lines
Sig Buy OR Sell;
y0 0;
y1 C[0];
TPrice C;
FirstVisibleBar Status"FirstVisibleBar" );
Lastvisiblebar Status"LastVisibleBar" );

for ( Firstvisiblebar<= Lastvisiblebar AND BarCountb++ )
{
    if ( Buy[b] )
    {
        Co colorRed;
        TPrice[b] = BuyPrice[b];
    }

    if ( Sell[b] )
    {
        Co colorBrightGreen;
        TPrice[b] = SellPrice[b];
    }

    if ( Sig[b] )
    {
        x0 y0;
        x1 y1;
        y0 b;
        y1 TPrice[b];
        PlotLineArrayx0x1y0y1 ), ""Co);
    }
}
// Improved version
// Dummy system to generate some signals
Buy CrossMACD(), Signal() );
BuyPrice O// Substitute your own prices
Sell CrossSignal(), MACD() );
SellPrice C// Substitute your own prices
PlotShapesIIfBuyshapeUpTriangleshapeNone ), colorBrightGreen0BuyPrice);
PlotShapesIIfSellshapeDownTriangleshapeNone ), colorRed0SellPrice);
PlotC""1128 );

// Plot the Trade Lines
Sig Buy OR Sell;
y0 0;
y1 C[0];
FirstVisibleBar Status"FirstVisibleBar" );
Lastvisiblebar Status"LastVisibleBar" );
CombinedColor colorWhite;
CombinedLine Null;

for ( Firstvisiblebar<= Lastvisiblebar AND BarCountb++ )
{

    if ( Buy[b] )
    {
        Co colorRed;
        TPrice[b] = BuyPrice[b];
    }
    else if ( Sell[b] )
    {
        Co colorBrightGreen;
        TPrice[b] = SellPrice[b];
    }

    if ( Sig[b] )

    {

        x0 y0;

        x1 y1;

        y0 b;

        y1 TPrice[b];

        La LineArrayx0x1y0y1 );

        CombinedLine IIfIsNullla ), CombinedLinela );
        CombinedColor IIfIsNullLa ), CombinedColorCo );
    }
}

PlotCombinedLine""CombinedColor );

Edited by Al Venosa