March 15, 2008
AFL Shapes Cheat Sheet
The plotshapes() can be used to plot shapes on your chart to indicate signals, stops, and other events and conditions. Figure 1 below gives a quick overview of the shapes that are available and includes a few undocumented ones. A PDF version suitable for printing is here: AFL Shapes Cheat Sheet
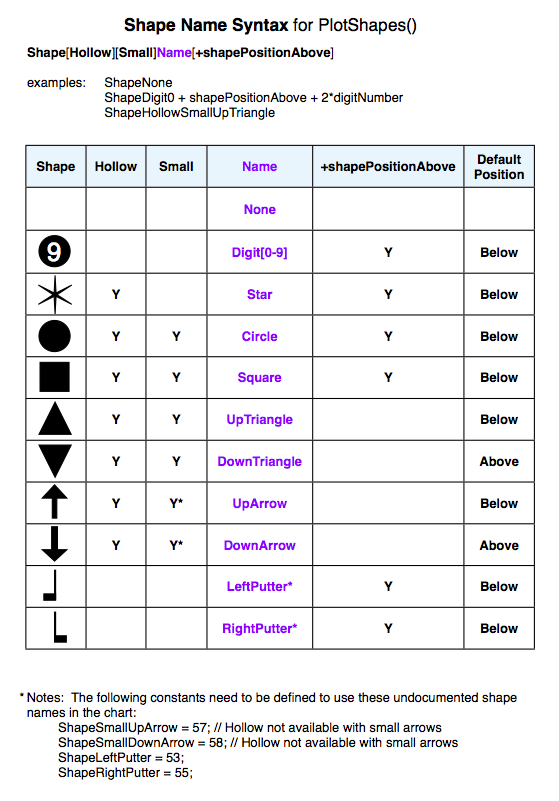
Figure 1
Figure 2 shows the small AFL program that was used to explore all the built-in shapes and their numerical values.
for ( i = 0; i < BarCount; i++ )
{
    O[i] = C[i] = i;
    H[i] = i + 5;
    L[i] = i - 5;

    if ( i % 2 == 0 )  {PlotText( NumToStr( i, 1.0, False ), i, L[i]-2, colorDarkGrey );}
    else  {PlotText( NumToStr( i, 1.0, False ), i, H[i]+.5, colorDarkGrey );}
}
PlotShapes( C, colorRed, 0, C, -10 );
Plot( C, "", colorLightGrey, styleBar );

Title = "Hollow = " + NumToStr( shapeHollowCircle - shapeCircle, 0, 0 ) + "\n" +
    "Small = " + NumToStr( shapeSmallCircle - shapeCircle, 0, 0 );
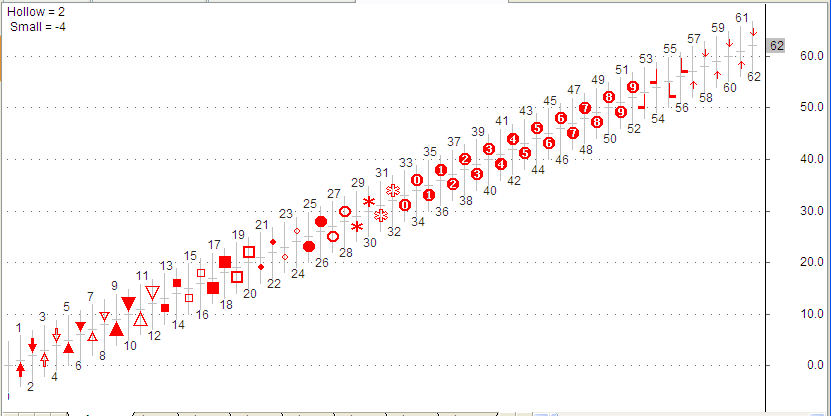
Figure 2
With additions by Herman
 Filed by Tomasz Janeczko at 5:01 pm under AFL - The Basics
Comments Off on AFL Shapes Cheat Sheet