March 20, 2008
Creating GFX Chart-Overlays (v3)
Important note: The AmiBroker 5.09.0 Beta introduced the following new GFX functions:
Status(“pxchartleft”) – returns x-coordinate of top-left corner of chart area
Status(“pxcharttop”) – returns y-coordinate of top-left corner of chart area
Status(“pxchartright”) – returns x-coordinate of bottom-right corner of chart area
Status(“pxchartbottom”) – returns y-coordinate of bottom-right corner of chart area
Status(“pxchartwidth”) – returns width chart area (right-left)
Status(“pxchartheight”) – returns width chart area (bottom-top)
Since this release appeared after this post was published these functions are not used in the examples below. This post has been left unchanged for educational purposes. For examples using the new functions please see the 5.09.0 Read Me file.
=====
Creating an exact chart overlay using GFX functions can be a daunting task for the non-professional programmer. The solutions presented here were derived through experimentation; if there is a better way, please make a comment. Once the pixel layout is fully understood, GFX becomes an extremely powerful tool and may just give you an additional trading edge. The first and most important step in using GFX functions is to understand how pixels make up your display. In AmiBroker the width and height of your charting pane can be retrieved using the following two functions:
pxwidth = Status("pxwidth");
pxheight = Status("pxheight");
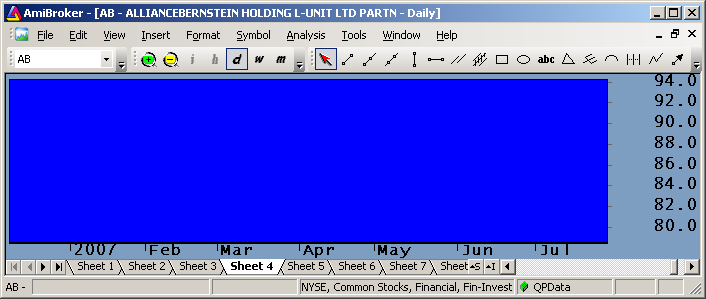
Horizontal pixels count left to right, 1 to pxwidth; vertical pixels count top to bottom, 1 to pxheight. The area covered by these two numbers is shown in Yellow below. For a high resolution monitor this area may cover about 2000 (H) x 1000 (V) pixels. This pixel area includes the areas used by the X and Y axis, and the blank top and bottom margins.
![]()
Next is the standard charting area, which is the area where your price charts are located. This area excludes the surrounding blank margins and the areas used for axis labeling. If you want to keep your overlay within the standard chart boundaries, you have to place your images within the above boundaries. This area is highlighted in Blue in the image below:
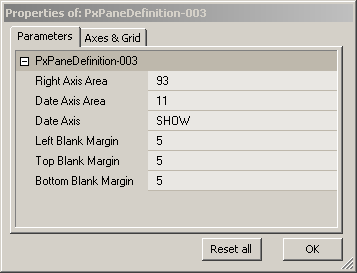
The boundaries for this area can be determined by running the example code listed in Finding Pixel Boundaries. Eight parameters must be known to create pixel overlays:
pxwidth = Status( "pxwidth" );
pxheight = Status( "pxheight" );
pxLeftArea = Param( "Left Blank Margin", 5, 0, 100, 1 ); // Constant
pxRightArea = Param( "Right Axis Area", 93, 0, 200, 1 ); // Depends on font
pxTopArea = Param( "Top Blank Margin", 5, 0, 100, 1 ); // Constant
pxDateArea = Param( "Date Axis Area", 11, 0, 100, 1 ); // Depends on font
pxBottomArea = Param( "Bottom Blank Margin", 5, 0, 100, 1 ); // Constant
DateaxisOn = ParamToggle( "Date Axis", "HIDE|SHOW", 1 );
Since adding date labels to your DateTime axis changes the size of your pixel plotting area, you need to compensate for this:
if( DateaxisOn )
    {
    pxBottomArea = pxDateArea + pxBottomArea;
    SetChartOptions(2,chartShowDates);
    }
else
    {
    SetChartOptions(3,chartShowDates);
    }
The pixel plotting area’s width and height can now be calculated:
pxPaneWidth = pxwidth - pxLeftArea- pxRightArea;
pxPaneHeight = pxHeight - pxTopArea- pxBottomArea;
The dimension of the Blue area shown earlier changes when you resize AmiBroker, open additional windows or panes, change the fonts in your axis, or turn On/Off date labels. When this happens you will have to recalibrate the boundaries. To convert prices to pixels, so that you can create an exact overlay, you also need to define the width and height of your regular chart pane. These are expressed in DateTime and Price units. They will change when you zoom your chart. When you have at least one price plot displayed, so that the values for miny and maxy are defined, you can calculate these boundaries as follows:
Miny = Status("axisminy");
Maxy = Status("axismaxy");
YRange = MaxY - MinY
BarsVisible = Status("BarVisible");
NumBarsVisible = Cum(BarsVisible);
You now have all the information needed to calculate the Pixels/Price and Pixels/Bar conversion factors:
PixelsPerBar     = pxPaneWidth / NumBarsVisible;
PixelsPerPrice = pxPaneHeight / YRange;
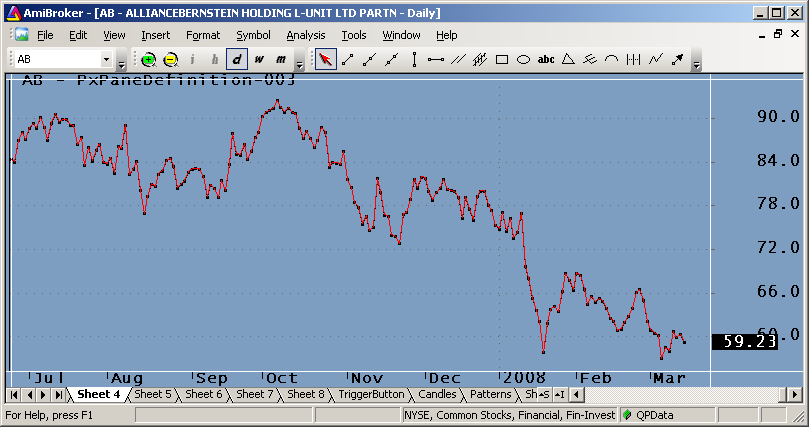
Putting it all together in a demo program (listed at the end of this post) produces the price-chart overlay shown below. The regular price plot is plotted using dots, so that the overlay is clearly visible. When you plot both traces in lines, you will see minor deviations that are probably due to rounding to the nearest pixel. The pixel price plot is shown in Red. The purpose of this exercise is to learn to work with pixels and be able to produce an exact overlay on the price chart. The Param window below the charts shows typical parameters; they will likely be different for your screen layout.
function gfxPlotHLine( YPixels, Color )
{
    global pxwidth;
    GfxSelectPen( Color ) ;
    GfxMoveTo( 0, YPixels );
    GfxLineTo( pxwidth, YPixels );
}

function gfxPlotVLine( XPixels, Color )
{
    global pxheight;
    GfxSelectPen( Color ) ;
    GfxMoveTo( XPixels, 0 );
    GfxLineTo( XPixels, pxheight );
}

function GetVisualBarIndex( )
{
    lvb = Status( "lastvisiblebar" );
    fvb = Status( "firstvisiblebar" );
    bi = BarIndex();
    StaticVarSet( "NumberbarsVisible", Lvb - fvb + 1 );
    return bi - bi[ 0 ] - fvb;
}

function GetYPixels( Y )
    {
    global PixelsPerPrice, pxTopArea, MaxY;
    return (MaxY - Y) * PixelsPerPrice + pxTopArea;
    }

function GetXPixels( X )
    {
    global PixelsPerBar, pxLeftArea;
    return X * PixelsPerBar + pxLeftArea;
    }

GraphXSpace = 5;
SetChartOptions( 0, chartHideQuoteMarker );

pxwidth = Status( "pxwidth" );
pxheight = Status( "pxheight" );

// These Parameters will change depending on screen layout/fonts
pxRightArea = Param( "Right Axis Area", 93, 0, 200, 1 ); // Depends on font
pxDateArea = Param( "Date Axis Area", 11, 0, 100, 1 ); // Depends on font
DateaxisOn = ParamToggle( "Date Axis", "HIDE|SHOW", 1 );

// These Parameters appear constant and can probably be hardcoded
pxLeftArea = Param( "Left Blank Margin", 5, 0, 100, 1 ); // Constant
pxTopArea = Param( "Top Blank Margin", 5, 0, 100, 1 ); // Constant
pxBottomArea = Param( "Bottom Blank Margin", 5, 0, 100, 1 ); // Constant

if ( DateaxisOn ) // Size of bottom boundary depends on whether dates are shown
{
    pxBottomArea = pxDateArea + pxBottomArea;
    SetChartOptions( 2, chartShowDates );
}
else
    SetChartOptions( 3, chartShowDates );

// Test Plots to help line up boundary lines
Color = colorWhite;
gfxPlotVLine( pxLeftArea, color );
gfxPlotVLine( pxwidth - pxRightArea, color );
gfxPlotHLine( pxTopArea, color );
gfxPlotHLine( pxHeight - pxBottomArea, color );

// Calculate Pane width and height
pxPaneWidth = pxwidth - pxLeftArea - pxRightArea;
pxPaneHeight = pxHeight - pxTopArea - pxBottomArea;

// clalculate charting area width and height
Plot( C, "", 1, styleDots );
Miny = Status( "axisminy" );
Maxy = Status( "axismaxy" );
YRange = MaxY - MinY;
VisBarIndex =  GetVisualBarIndex( );
NumBarsVisible = StaticVarGet( "NumberbarsVisible" );

// calculate conversion factors
PixelsPerBar     = pxPaneWidth / NumBarsVisible;
PixelsPerPrice = pxPaneHeight / YRange;

// For verification: Overlay pixel on price plot
FVB = Status( "firstvisiblebar" );
LVB = Status( "lastvisiblebar" );
GfxSelectPen( colorRed );
for ( b = FVB + 1; b <= LVB AND b < BarCount; b++ )
{
    PrevPixelY = GetYPixels( C[b-1] );
    PixelY = GetYPixels( C[b] );

    PrevPixelX = GetXPixels( VisBarIndex[b-1] );
    PixelX = GetXPixels( VisBarIndex[b] );

    GfxMoveTo( PrevPixelX, PrevPixelY );
    GfxLineTo( PixelX, PixelY );
}
Edited by Al Venosa.
 Filed by Herman at 8:10 pm under GFX Programming
Comments Off on Creating GFX Chart-Overlays (v3)