March 14, 2008
Finding Pixel Boundaries
Important note: The AmiBroker 5.09.0 Beta introduced the following new GFX functions:
Status(“pxchartleft”) – returns x-coordinate of top-left corner of chart area
Status(“pxcharttop”) – returns y-coordinate of top-left corner of chart area
Status(“pxchartright”) – returns x-coordinate of bottom-right corner of chart area
Status(“pxchartbottom”) – returns y-coordinate of bottom-right corner of chart area
Status(“pxchartwidth”) – returns width chart area (right-left)
Status(“pxchartheight”) – returns width chart area (bottom-top)
Since this release appeared after this post was published these functions are not used in the examples below. This post has been left unchanged for educational purposes. For examples using the new functions please see the 5.09.0 Read Me file.
=====
The first requirement when designing chart overlays and/or control panels is to know the exact dimensions of your charting pane. These are expressed in pixels. The numerical values where the margins (the four edges of your charting pane) are located depends on the resolution of your monitor, the size of the chart pane, and the fonts used to label your axis.
Currently the only way to obtain the values is, as far as I know, to determine the pane boundaries manually. The code below plots four lines that you can position using sliders in the Param window. When the lines fall exactly on the edges of your charting pane you can read the pixel value in the Param window and in the chart Title. See the image below and note how the blue lines hide the regular black chart frame:
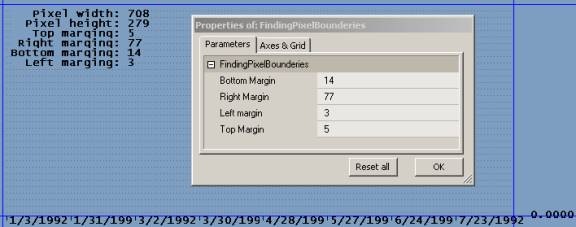
Try changing the size of your charting pane, the overall AmiBroker window, and the font for the axis, to see how the pixel values change. Be aware that opening multiple chart panes and/or windows will also change pixel values. Also, probably to ensure that the first bar shows, the left edge of your charting pane is located at the third pixel, while actual bars start plotting at the fifth pixel. This means that trying to overlay the Blue line to determine the left boundary will be offset to the left by two pixels. To use the code below copy it to a new Indicator formula window and click Apply.
function gfxPlotHLine( YPixels, Color )
{
    global pxwidth;
    GfxSelectPen( Color ) ;
    GfxMoveTo( 0, YPixels );
    GfxLineTo( pxwidth, YPixels );
}

function gfxPlotVLine( XPixels, Color )
{
    global pxheight;
    GfxSelectPen( Color ) ;
    GfxMoveTo( XPixels, 0 );
    GfxLineTo( XPixels, pxheight );
}

GraphXSpace = 0;
SetChartOptions( 2, chartHideQuoteMarker );

pxwidth = Status( "pxwidth" );
pxheight = Status( "pxheight" );

BottomMargin = Param( "Bottom Margin", 14, 0, 100 );
gfxPlotHLine( pxheight - BottomMargin, 6 );

RightMargin = Param( "Right Margin", 77, 0, 100 );
gfxPlotVLine( pxwidth - RightMargin, 6 );

LeftMargin = Param( "Left margin", 3, 0, 100 );
gfxPlotVLine( LeftMargin, 6 );

TopMargin = Param( "Top Margin", 5, 0, 100 );
gfxPlotHLine( TopMargin, 6 );

Title="\n"+
"   Pixel width: "+NumToStr(pxwidth,1.0,False)+"\n"+
"  Pixel height: "+NumToStr(pxheight,1.0,False)+"\n"+
"   Top marging: "+NumToStr(TopMargin,1.0,False)+"\n"+
" Right marging: "+NumToStr(RightMargin,1.0,False)+"\n"+
"Bottom marging: "+NumToStr(BottomMargin,1.0,False)+"\n"+
"  Left marging: "+NumToStr(LeftMargin,1.0,False);
 Filed by Herman at 11:35 am under GFX Programming
Comments Off on Finding Pixel Boundaries