Using IIF(), IF() and Switch() functions

Many newcomers to AFL are confused by the IF(), IIF() and Switch(). This post gives a few simple examples of their use. The IF() and Switch() are program flow control statements, the IIF() is a function that acts on all elements of an input array and returns an output array.

In all but the simplest applications the Switch() is the preferred method to the IF() to change program flow. It can be used to code complex decision trees and state machines, for example as these are often needed in automated trading systems.

For more detailed explanations click IF(), IIF(), or Switch(). A search of the afl library will also get you many more examples.

The IIF() function

It is possible to use if()s to individually test and modify each bar in an array for a condition. An example on how this would be done is shown in the function below (copied from the AmiBroker help). This function is an AFL equivalent for the IIF() function.

function IIF_AFLconditioninputAinputB )
{
    result Null;
    for( bar 0bar BarCountbar++ )
    {
       if( conditionbar ] )
           resultbar ] = inputAbar ];
       else
           resultbar ] = inputBbar ];
     }
    return result;
}

While the above approach works, using the IIF() function always provides a better and faster solution. The IIF() is very powerful and should be used whenever possible. Below are a few simple examples to get started. btw, It is highly unlikely that you will be able to improve on execution time by using a loop or writing a DLL.

To color all bars that fall on a Monday White:

Color IIfDayOfWeek()==1colorWhitecolorBlack);
PlotC"Close"colorstyleBar );

IIF()s Can be nested. This example colors Monday bars White, Wednesday bars Blue and Friday bars Yellow:

DayOfWeek();
Color IIf(D==1colorWhiteIIf(D==3colorBlueIIf(D==5colorYellowcolorBlack)));
PlotC"Close"colorstyleBar );

The IF() Statement

One of the most common applications for the if() is to select what you want to see on your chart:


PlotC"Close"colorBlackstyleBar );
ShowMA10 ParamToggle"Moving Average""MA|EMA");

if ( ShowMA10 )
{
PlotMAC10 ), "MA10"colorWhitestyleLine );
}
else
{
PlotEMAC10 ), "MA10"colorWhitestyleLine );
}

In the above example the IF() basically selects one of two sections of code.  To select one of many options you could the use the else-if extension:


SelectedIndicator ParamList"Show""MA10,MA50,MA100");

if ( SelectedIndicator == "MA10" )
{
PlotMAC10 ), "MA10"colorBluestyleLine );
}
else
if ( SelectedIndicator == "MA10" )
{
PlotEMAC50 ), "MA10"colorRedstyleLine );
}
else
if ( SelectedIndicator == "MA100" )
{
PlotEMAC100 ), "MA100"colorYellowstyleLine );
}

The Switch() Statement

When there are many conditions, the lengthy If() expressions can become confusing, difficult to compose, and difficult to modify. In such cases it is often better to use the Switch() statement. Using a simple Switch() the last example looks much cleaner:


SelectedIndicator ParamList"Show""MA10,MA50,MA100");
switch ( SelectedIndicator )
{

case "MA10":
PlotMAC10 ), "MA10"colorBluestyleLine );
break;

case "MA50":
PlotMAC50 ), "MA50"colorBluestyleLine );
break;

case "MA100":
PlotMAC100 ), "MA100"colorBluestyleLine );
break;
}

There are times that you will have many individually named variables that you would like to process in a Switch() statement. Even though the Switch() can only accept a single variable name as argument you can use the method below to work around this limitation:

function SayOnceText )
{
    if ( StaticVarGetText"Lastsay" ) != Text )
    {
        SayTextFalse );
        StaticVarSetText"LastSay"Text );
    }
}

RequestTimedRefresh(1);
Trigger1 ParamTrigger"Trigger 1""TRIGGER1" );
Trigger2 ParamTrigger"Trigger 2""TRIGGER2" );
Trigger3 ParamTrigger"Trigger 3""TRIGGER3" );
Trigger4 ParamTrigger"Trigger 4""TRIGGER4" );

switch( )
{
    case Trigger1:
    SayOnce"One" );
    break;

    case Trigger2:
    case Trigger4:
    SayOnce"2 or 4" );
    break;

    case Trigger3:
    SayOnce"Three" );
    break;

    default:
    SayOnce"Default" );
    // Here you can place code that will execute
    // repeatedly while no other case is true
}

The Switch() argument can be a string or number. Using strings makes code easier to read. Another advantage of using the Switch() is that they format nicely using Edit->Prettify Selection in you editor window, using too many else-if statements tends to run the if()s of the page. As shown above you can stack case statements to have multiple conditions trigger the same task.

To implement a simple State Machine you pass the system “state” to the Switch(). This way you can have any event trigger any sequence of tasks, and do so in any desired order. In a real application the SayOnce() functions in the example code below would be replaced by the task you want to be performed in the state. The next state would usually be conditionally set inside each state, for example you only want to proceed to the next state after an order is filled, or a price is crossed. You can use multilevel Switch()s or if()s inside each case section. This use of Switch() statements is very useful in Automated Trading systems. For example to process order status (Pending, Filled, Error, etc) and parsing TWS error messages.

Since states are saved in a Static Variables they remain valid over multiple AFL executions, and can last indefinitely. You can also save states in Persistent Variables.

States are processed in sequential afl executions, i.e., if you change the state in a case statement this next state will be processed in the next AFL refresh. In some applications this delay can cause problems. To ensure responsive code you might want to use a 0.1 second refresh rate. You could remove the delay by using the Switch() inside a loop/while statement, anf loop until a stable state is reached.

function SayOnceText )
{
    if ( StaticVarGetText"Lastsay" ) != Text )
    {
        SayTextFalse );
        StaticVarSetText"LastSay"Text );
    }
}

RequestTimedRefresh(1);
if( ParamTrigger"Reset System""RESET" ) ) StaticVarSetText"State""RESET" );
if( ParamTrigger"Task 1""TASK 1" ) ) StaticVarSetText"State""TASK1" );
if( ParamTrigger"Task 2""TASK 2" ) ) StaticVarSetText"State""TASK2" );
if( ParamTrigger"Task 3""TASK 3" ) ) StaticVarSetText"State""TASK3" );

State StaticVarGetText"State" );
switch( State )
{
    case "RESET":
    SayOnce"Reset" );
    StaticVarSetText"State""READY" );
    break;

    case "READY":
    SayOnce"Ready" );
    StaticVarSetText"State""IDLE" );
    break;

    case "TASK1":
    SayOnce"Task 1" );
    StaticVarSetText"State""IDLE" );
    break;

    case "TASK2":
    SayOnce"Task 2" );
    StaticVarSetText"State""TASK1" );
    break;

    case "TASK3":
    SayOnce"Task 3" );
    StaticVarSetText"State""TASK2" );
    break;

    case "IDLE":
    SayOnce"Idle" );
    break;
}

Equalize X-Range for all windows

This function was requested on the main list, and was solved with the help of several expert programmers from the list. Thanks guys!

This function can be copied to an include file that is included in each program from which you might want to synchronize the datetime range for all visible windows. The function places a small [R] button at the right top of your chart. Clicking this button will set the datetime ranges of all windows equal to the one you click the button in. Note that this window has to be active for the button to work, i.e., if the window was not active (selected) it will require two clicks for the button to respond.

function RangeAllWindows()
{
    MX GetCursorXPosition);
    MY GetCursorYPosition);
    LeftClick GetCursorMouseButtons() == 9;

    // Place Ranging Button
    ButtonSize=20;
    X2 Status"pxchartright" )+1;
    X1 X2 ButtonSize;
    Y1 0;
    Y2 Y1 ButtonSize;
    GfxSelectFont"Tahoma"ButtonSize 1.5800 );
    GfxSelectPencolorBlack );
    GfxSelectSolidBrushcolorYellow );
    GfxRectangleX1Y1X2Y2 );
    GfxSetTextColorcolorBlack );
    GfxSetBkMode);
    GfxDrawText"R"X1Y1X2Y241 );
    OnButton MX >= X1 AND MY >= Y1 AND MX <= X2 AND MY <= Y2;

    if ( OnButton AND LeftClick )
    {
        DT DateTime();
        BI BarIndex();
        FirstBarIndex Status"firstvisiblebarindex" );
        LastBarIndex Status"lastvisiblebarindex" );
        FirstDateTime LastValueValueWhenFirstBarIndex == BIDT ) );
        LastDateTime LastValueValueWhenLastBarIndex == BIDT ) );
        FirstDateTimestr DateTimeToStrFirstDateTime );
        LastDateTimestr DateTimeToStrLastDateTime );
        AB CreateObject"Broker.Application" );
        docs AB.Documents;
        Qty docs.Count;

        for ( 0Qtyi++ ) // Range all windows
        {
            doc docs.Item);
            AW doc.ActiveWindow;
            AW.Activate();
            AW.ZoomToRangeFirstDateTimestrLastDateTimestr );
            // correct shift due to blank bars
            WSHShell CreateObject"WScript.Shell" );
            WSHShell.AppActivate"AmiBroker" );
            WSHShell.Sendkeys"{PGDN}" );
        }
    }
}

//Demo Code
RangeAllWindows();
Plot(C,"",1,128);

Adding Help-Tips to your programs

If you write AmiBroker programs that are used by others you have undoubtedly found that documenting your program and answering hundreds of emails can be very time consuming. You can save yourself, and those who use your code, a lot of time by adding Help popups (Tips) to your programs. No longer will users have to search though manuals and/or write emails to find basic instructions. Of course you will save time as well since you don’t have to answer all those emails :-) If you don’t program for others, read on, because there are some other applications that may interest you.

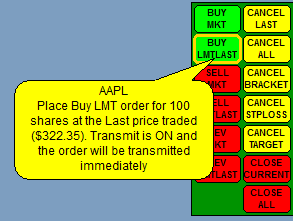
When Tips are enabled they will display as a balloon when hovering the cursor over a defined object or area, no clicks are required. Here is a typical Tip:

Tips can be used with gfx Control panels, trading dashboards, charts (function like the interpretation screen and now defunct ToolTip), tabular data, system status displays, gfx menus, caution and alert messages, etc. Your imagination sets the limits. Of course you can change the balloon size, colors, fonts, shape, etc. to your requirements. The code for the trading buttons shown is not provided in this post – that could be another topic.

Tips can display real-time market and system information. In the above example the Last price and a cautionary warning that Transmit is turned ON reflect real-time status.

In this post Tips are placed relative to the mouse’s cursor position. In chart applications you might want to use dynamically placed Tips that point to a critical event or condition on your chart. You would do this by converting price and bars to pixels and replace the MX and MY variables in the code with calculated values. For more on this see How to convert from bar-value to pixel coordinates on the AmiBroker Knowledge Base.

When I write button functions I add Tip information as the last argument to the function, this way the information is right where it is defined by the code. This is also helpful when reading the code. The actual Tip text can be repeated in your manual as a text box so that a clear association exists.

The code in this post demonstrates how the balloon reorients itself depending on in which quadrant of the pane the cursor is located. This is done to keep tips within the pane area, even when hovering over an object close to the edge of the pane. Here is a short video to see how this works.

If, on your computer, the Tip tracks the mouse cursor slower than in the video this is because I have enabled the higher refresh rate of 0.1 second. Tomasz explained this in post 151255 on the main AmiBroker list. Making errors while editing your Registry can cause serious computer problems, if you haven’t done this before, please seek professional help.

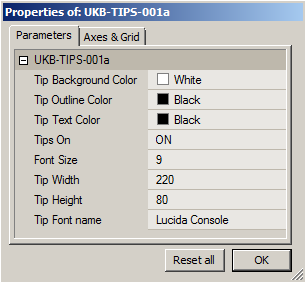
All code in this post is solely intended to show you how to develop Tips. They serve no other purpose. To help you experiment I used Param() instead of hard-coding Tip properties:

Have fun!


function ShowTipTipColorTipOutlineColorTipTextColor )
{
global MXMYPxWidthPxHeightTipWidthTipHeightTipsOnTipFontNameTipFontSize;
TipMsg VarGetText"TipMsg" );

if ( TipsOn AND TipMsg != "" )
{
Quadrant = ( MX &ltpxwidth ) + ( MY &ltpxheight ) * 2;
D  30// Rounding Diameter

switch ( Quadrant )
{

case 3:
X1 MX;
Y1 MY 0.75;
X2 MX TipWidth;
Y2 MY TipHeight 0.75;
X3 MX 0.75;
Y3 Y1;
X4 MX 2;
Y4 Y1;
X5 MX;
Y5 MY;
break;

case 2:
X1 MX TipWidth;
Y1 MY 0.75;
X2 MX;
Y2 MY TipHeight 0.75;
X3 MX 0.75;
Y3 Y1;
X4 MX 2;
Y4 Y1;
X5 MX;
Y5 MY;
break;

case 1:
X1 MX;
Y1 MY TipHeight 0.75;
X2 X1 TipWidth;
Y2 Y1 TipHeight;
X3 MX D;
Y3 Y2 1;
X4 MX 0.75;
Y4 Y2 1;
X5 MX;
Y5 y2 0.75;
break;

case 0:
X1 MX TipWidth;
Y1 MY TipHeight 0.75// Rectangle
X2 X1 TipWidth;
Y2 Y1 TipHeight;
X3 X2 D;
Y3 Y2 1// Pointer
X4 X2 0.75;
Y4 Y2 1;
X5 X2;
Y5 y2 0.75;
break;

default:
x1 x2 x3 x4 x5 y1 y2 y3 y4 y5 0;
}

GfxSetBkMode);

GfxSelectPenTipOutlineColor );
GfxSetTextColorTipTextColor );
GfxSelectFontTipFontnameTipFontSize );
GfxSelectSolidBrushTipColor );
GfxRoundRectX1y1x2y2D);
GfxPolygon(   X3Y3 X4 Y4X5Y5 );     // Pointer
GfxSelectPenTipColor ); // Hide line between RoundRect and Pointer
GfxMoveToX3Y3 );
GfxLineToX4Y4 );
GfxDrawTextTipMsgx1 10y1 3x2 10y2 516 65 );
}
}

function TestObjectLabelX1Y1X2Y2Color // Do-Nothing Demo function only
{
GfxSelectPencolorBlack );
GfxSelectSolidBrushColor );
GfxRectangleX1y1x2y2 );
OverObject MX &gtx1 AND MX &ltx2 AND MY &gty1 AND MY &lty2;

if ( OverObject )
VarSetText"TipMsg""The cursor is now over the " Label +
" quadrant and the shape of the Tip is adjusted accordingly." );

return OverObject;
}

// Global variables and parameters can be hard-coded in the final application
global MXMYPxWidthPxHeightTipWidthTipHeightTipsOnFontNameFontSize;
TipColor          ParamColor"Tip Background Color"colorWhite );
TipOutlineColor ParamColor"Tip Outline Color"colorBlack );
TipTextColor   ParamColor"Tip Text Color"colorBlack );
TipsOn             ParamToggle"Tips On""OFF|ON");
TipFontSize    Param"Font Size"9024);
TipWidth          Param"Tip Width"2205050010 );
TipHeight         Param"Tip Height"805050010 );
TipFontName       ParamStr"Tip Font name""Lucida Console" );

GfxSetBkMode);
GfxSetOverlayMode);
RequestTimedRefresh0.1 );
MX         GetCursorXPosition);
MY         GetCursorYPosition);
PxWidth    Status"pxwidth" );
PxHeight    Status"pxheight" );

// In a real application each colored area could be s small button
TestObject"UpperLeft"00pxwidth 2pxheight 2colorRed );
TestObject"UpperRight"pxwidth 20pxwidthpxheight 2colorBlue );
TestObject"LowerLeft"0pxheight 2pxwidth 2pxheightcolorYellow );
TestObject"Lowerright"pxwidth 2pxheight 2pxwidthpxheightcolorBrightGreen );

ShowTipTipColorTipOutlineColorTipTextColor ); // Place this call at the very endo of your code

Date and Time to Number Conversions

Code developed and kindly donated by Murthy Suresh.

{
    dd_ StrToNumStrRightaaaammdd) );    //printf(WriteVal(dd_) + " "  );
    mm_ StrToNumStrMidaaaammdd4) );    //printf(WriteVal(mm_) + " "  );
    aa_ StrToNumStrLeftaaaammdd) );    //printf(WriteVal(aa_) + " " + "\n" );
    Date_Num = ( 10000 * ( aa_ 1900 ) ) + ( 100 mm_ ) + dd_;
    RESULT Date_Num;
    return RESULT;
}

function Time_To_NumstrTime // format for time is hh:mm:ss
{
    /*
    //do something to raise alert  if length does not match
    ????PopupWindow("Current time is: " + Now(),"Alert", 2,
    640*mtRandom(), 480*mtRandom());
    */
    hh_t StrToNumStrLeftstrTime) );    //printf(WriteVal( hh_t ) + " "  );
    mm_t StrToNumStrMidstrTime3) );    //printf(WriteVal( mm_t ) + " "  );
    ss_t StrToNumStrRightstrTime) );    //printf(WriteVal( ss_t ) + " "  + "\n"  );
    Time_Num 10000 hh_t 100 mm_t ss_t;
    RESULT Time_Num;
    return RESULT;

Popup Window: Preventing pile-ups

By Dennis Brown

The popup window is a great tool in debugging and can help you to keep track of what your code is doing or it can be used to alert you to special situations in your normally running formula. A common problem is that if you call PopupWindow() from a loop or if one gets generated on every AFL pass, you can get hundreds or even thousands of pop-ups piling up on your screen. Tomasz posted a simple work-around on the AmiBroker Feedback Center that took care of the problem in some cases (Suggestion 1528):

The following is a more complete version of this solution that adds a popupID to keep track of each individual popup window and re-enable the popup after its specified timeout period, or if any of the displayed text changes:

function GetSecondNum()
{
    Time Now);
    Seconds intTime 100 );
    Minutes intTime 100 100 );
    Hours intTime 10000 100 );
    SecondNum intHours 60 60 Minutes 60 Seconds );
    return SecondNum;
}

function PopupWindowExpopupIDbodytextcaptiontexttimeoutlefttop )
{
    displayText bodytext captiontext;
    if ( ( StaticVarGetText"prevPopup" popupID ) != displayText) OR ( StaticVarGet"prevPopupTime" popupID ) < GetSecondNum() ) )
    {
        StaticVarSetText"prevPopup" popupIDdisplayText);
        StaticVarSet"prevPopupTime" popupIDGetSecondNum() + timeout );
        PopupWindowbodytextCaptiontext popupIDtimeoutLefttop );
    }
}

PopupWindowEx"ID:1""testing""test alert "5, -1, -);
PopupWindowEx"ID:2""testing""test alert "50);

Using a GFX Include file

Important note: The AmiBroker 5.09.0 Beta introduced the following new GFX functions:

Status(“pxchartleft”) – returns x-coordinate of top-left corner of chart area
Status(“pxcharttop”) – returns y-coordinate of top-left corner of chart area
Status(“pxchartright”) – returns x-coordinate of bottom-right corner of chart area
Status(“pxchartbottom”) – returns y-coordinate of bottom-right corner of chart area
Status(“pxchartwidth”) – returns width chart area (right-left)
Status(“pxchartheight”) – returns width chart area (bottom-top)

Since this release appeared after this post was published these functions are not used in the examples below. This post has been left unchanged for educational purposes. For examples using the new functions please see the 5.09.0 Read Me file.

=====

While the post Creating GFX Chart-Overlays (v2) may have clarified a few of the more important aspects of using GFX functions, it doesn’t really give you a “quick Start” template to get started. Using a GFXInclude file can remove some of the burden of having to define pixel and charting parameters. The Include file at the bottom of this post contains most definitions as well as these common functions that you may want to call from your GFX application:

GetVisualBarIndex( ); // Returns array containing index for visible bars
gfxPlotHLineYPixelsColor ); // Plots horizontal line at level YPixels
gfxPlotVLineXPixelsColor ); // plots vertical line at level XPixels
GetYPixels); // Convert a vertical price number to the pixel equivalent
GetXPixels); // Convert a horizontal DateTime number value to the pixel equivalent

Of course you can, and should, add additional functions of your own. Here is an example of how to call the above functions to draw a GFX cross-hair cursor (Red in the capture):

gfxcrosshair.jpg

Here is the code that produced the above image:

GraphXSpace 5// See the AmiBroker help on how to init these variables
GfxSetBkModebkmode );
GfxSetOverlayModemode );
GfxSelectPencolorRed );
 
PlotC""colorBlackstyleLine ); // To define miny and maxy
#include <GFXInclude-001.afl> // Located in your default Include folder
 
// Example to draw cross-hair cursor
Yprice GetCursorYPosition(0);
XIndex SelectedValue(GetVisualBarIndex( ));
gfxPlotHLineGetYPixelsYPrice ), colorRed );
gfxPlotVLineGetXPixelsXIndex ), colorRed );

The include file listed below defines the following variables:

// pxwidth, pxheight, Miny, MinX, YRange, VisBarIndex, NumBarsVisible, pxPaneWidth, pxPaneheight, PixelsPerBar, PixelsPerPrice

You may want to copy the above comment line below the #include statement in your code to refresh your memory. You should copy the Include file to your default AmiBroker Include folder.

// GFXInclude-001.afl copy to default include folder

function gfxPlotHLineYPixelsColor )
{
    global pxwidth;
    GfxSelectPenColor ) ;
    GfxMoveTo0YPixels );
    GfxLineTopxwidthYPixels );
}
 
function gfxPlotVLineXPixelsColor )
{
    global pxheight;
    GfxSelectPenColor ) ;
    GfxMoveToXPixels);
    GfxLineToXPixelspxheight );
}
 
function GetVisualBarIndex( )
{
    lvb Status"lastvisiblebar" );
    fvb Status"firstvisiblebar" );
    bi BarIndex();
    StaticVarSet"NumberbarsVisible"Lvb fvb );
    return bi bi] - fvb;
}

function GetYPixels)
    {
    global PixelsPerPricepxTopAreaMaxY; 
    return (MaxY Y) * PixelsPerPrice pxTopArea;
    }

function GetXPixels)
    {
    global PixelsPerBarpxLeftArea;
    return PixelsPerBar pxLeftArea;
    }

_SECTION_BEGIN("GFX INITIALIZATION");
// These Parameters will change depending on screen layout/fonts
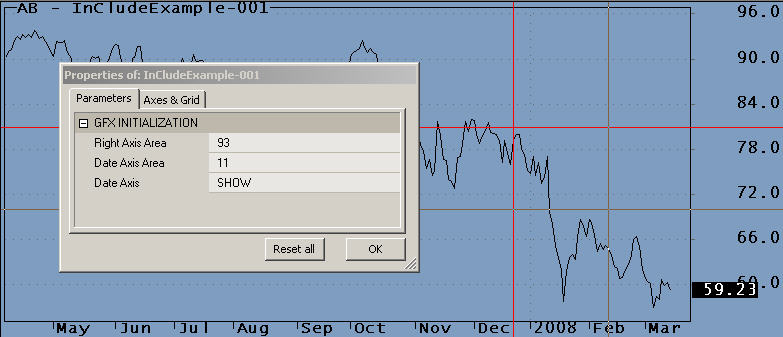
pxRightArea Param"Right Axis Area"930200); // Depends on font
pxDateArea Param"Date Axis Area"110100); // Depends on font
DateaxisOn ParamToggle"Date Axis""HIDE|SHOW");

pxLeftArea 5pxTopArea 5pxBottomArea 5; 
if ( DateaxisOn )
{
    pxBottomArea pxDateArea pxBottomArea;
    SetChartOptions2chartShowDates );
}
else
    SetChartOptions3chartShowDates );

pxwidth Status"pxwidth" );
pxheight Status"pxheight" );

// clalculate charting area width and height
Miny Status"axisminy" );
Maxy Status"axismaxy" );
YRange MaxY MinY;
VisBarIndex =  GetVisualBarIndex( );
NumBarsVisible StaticVarGet"NumberbarsVisible" );

// Calculate Pane width and height
pxPaneWidth pxwidth pxLeftArea pxRightArea;
pxPaneHeight pxHeight pxTopArea pxBottomArea;

// calculate conversion factors
PixelsPerBar     pxPaneWidth NumBarsVisible;
PixelsPerPrice pxPaneHeight YRange;
_SECTION_END();

Edited by Al Venosa.

Creating GFX Chart-Overlays (v3)

Important note: The AmiBroker 5.09.0 Beta introduced the following new GFX functions:

Status(“pxchartleft”) – returns x-coordinate of top-left corner of chart area
Status(“pxcharttop”) – returns y-coordinate of top-left corner of chart area
Status(“pxchartright”) – returns x-coordinate of bottom-right corner of chart area
Status(“pxchartbottom”) – returns y-coordinate of bottom-right corner of chart area
Status(“pxchartwidth”) – returns width chart area (right-left)
Status(“pxchartheight”) – returns width chart area (bottom-top)

Since this release appeared after this post was published these functions are not used in the examples below. This post has been left unchanged for educational purposes. For examples using the new functions please see the 5.09.0 Read Me file.

=====

Creating an exact chart overlay using GFX functions can be a daunting task for the non-professional programmer. The solutions presented here were derived through experimentation; if there is a better way, please make a comment. Once the pixel layout is fully understood, GFX becomes an extremely powerful tool and may just give you an additional trading edge. The first and most important step in using GFX functions is to understand how pixels make up your display. In AmiBroker the width and height of your charting pane can be retrieved using the following two functions:

pxwidth Status("pxwidth");
pxheight Status("pxheight");

Horizontal pixels count left to right, 1 to pxwidth; vertical pixels count top to bottom, 1 to pxheight. The area covered by these two numbers is shown in Yellow below. For a high resolution monitor this area may cover about 2000 (H) x 1000 (V) pixels. This pixel area includes the areas used by the X and Y axis, and the blank top and bottom margins.

pixelarea.png

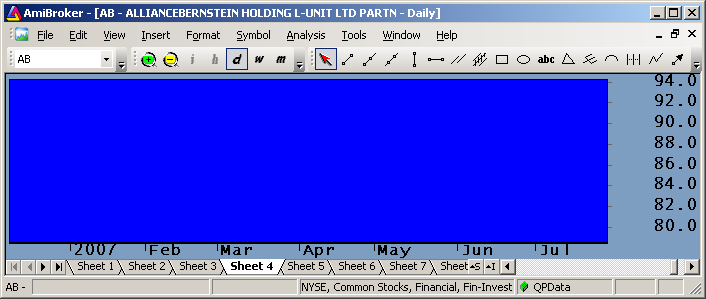
Next is the standard charting area, which is the area where your price charts are located. This area excludes the surrounding blank margins and the areas used for axis labeling. If you want to keep your overlay within the standard chart boundaries, you have to place your images within the above boundaries. This area is highlighted in Blue in the image below:

chartingarea.png

The boundaries for this area can be determined by running the example code listed in Finding Pixel Boundaries. Eight parameters must be known to create pixel overlays:

pxwidth Status"pxwidth" );
pxheight Status"pxheight" );
pxLeftArea Param"Left Blank Margin"50100); // Constant
pxRightArea Param"Right Axis Area"930200); // Depends on font
pxTopArea Param"Top Blank Margin"50100); // Constant
pxDateArea Param"Date Axis Area"110100); // Depends on font
pxBottomArea Param"Bottom Blank Margin"50100); // Constant
DateaxisOn ParamToggle"Date Axis""HIDE|SHOW");

Since adding date labels to your DateTime axis changes the size of your pixel plotting area, you need to compensate for this:

if( DateaxisOn ) 
    {
    pxBottomArea pxDateArea pxBottomArea;
    SetChartOptions(2,chartShowDates);
    }
else 
    {
    SetChartOptions(3,chartShowDates);
    }

The pixel plotting area’s width and height can now be calculated:

pxPaneWidth pxwidth pxLeftAreapxRightArea;
pxPaneHeight pxHeight pxTopAreapxBottomArea;

The dimension of the Blue area shown earlier changes when you resize AmiBroker, open additional windows or panes, change the fonts in your axis, or turn On/Off date labels. When this happens you will have to recalibrate the boundaries. To convert prices to pixels, so that you can create an exact overlay, you also need to define the width and height of your regular chart pane. These are expressed in DateTime and Price units. They will change when you zoom your chart. When you have at least one price plot displayed, so that the values for miny and maxy are defined, you can calculate these boundaries as follows:

Miny Status("axisminy");
Maxy Status("axismaxy");
YRange MaxY MinY
BarsVisible Status("BarVisible");
NumBarsVisible Cum(BarsVisible);

You now have all the information needed to calculate the Pixels/Price and Pixels/Bar conversion factors:

PixelsPerBar     pxPaneWidth NumBarsVisible;
PixelsPerPrice pxPaneHeight YRange;

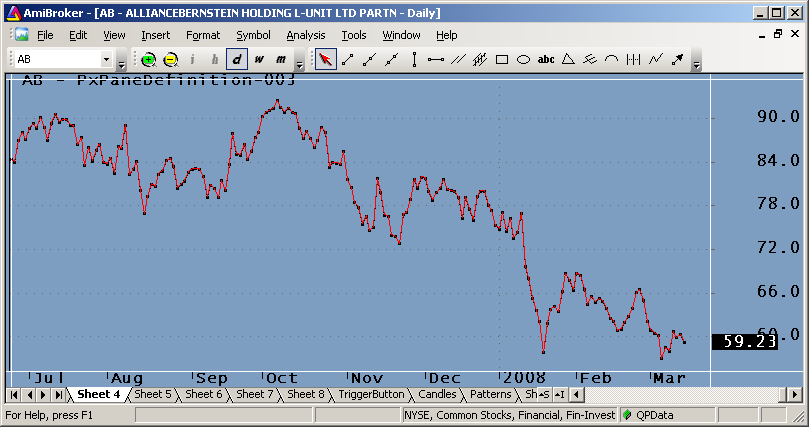
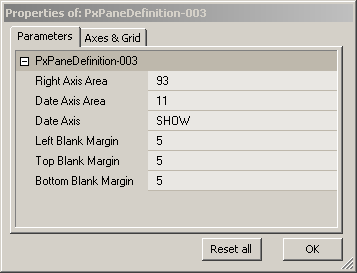
Putting it all together in a demo program (listed at the end of this post) produces the price-chart overlay shown below. The regular price plot is plotted using dots, so that the overlay is clearly visible. When you plot both traces in lines, you will see minor deviations that are probably due to rounding to the nearest pixel. The pixel price plot is shown in Red. The purpose of this exercise is to learn to work with pixels and be able to produce an exact overlay on the price chart. The Param window below the charts shows typical parameters; they will likely be different for your screen layout.

pricechartoverlay1.png

pricechartoverlayparam.png

function gfxPlotHLineYPixelsColor )
{
    global pxwidth;
    GfxSelectPenColor ) ;
    GfxMoveTo0YPixels );
    GfxLineTopxwidthYPixels );
}
 
function gfxPlotVLineXPixelsColor )
{
    global pxheight;
    GfxSelectPenColor ) ;
    GfxMoveToXPixels);
    GfxLineToXPixelspxheight );
}
 
function GetVisualBarIndex( )
{
    lvb Status"lastvisiblebar" );
    fvb Status"firstvisiblebar" );
    bi BarIndex();
    StaticVarSet"NumberbarsVisible"Lvb fvb );
    return bi bi] - fvb;
}

function GetYPixels)
    {
    global PixelsPerPricepxTopAreaMaxY; 
    return (MaxY Y) * PixelsPerPrice pxTopArea;
    }

function GetXPixels)
    {
    global PixelsPerBarpxLeftArea;
    return PixelsPerBar pxLeftArea;
    }
 
GraphXSpace 5;
SetChartOptions0chartHideQuoteMarker );

pxwidth Status"pxwidth" );
pxheight Status"pxheight" );

// These Parameters will change depending on screen layout/fonts
pxRightArea Param"Right Axis Area"930200); // Depends on font
pxDateArea Param"Date Axis Area"110100); // Depends on font
DateaxisOn ParamToggle"Date Axis""HIDE|SHOW");

// These Parameters appear constant and can probably be hardcoded
pxLeftArea Param"Left Blank Margin"50100); // Constant
pxTopArea Param"Top Blank Margin"50100); // Constant
pxBottomArea Param"Bottom Blank Margin"50100); // Constant
 
if ( DateaxisOn // Size of bottom boundary depends on whether dates are shown
{
    pxBottomArea pxDateArea pxBottomArea;
    SetChartOptions2chartShowDates );
}
else
    SetChartOptions3chartShowDates );
 
// Test Plots to help line up boundary lines
Color colorWhite;
gfxPlotVLinepxLeftAreacolor );
gfxPlotVLinepxwidth pxRightAreacolor );
gfxPlotHLinepxTopAreacolor );
gfxPlotHLinepxHeight pxBottomAreacolor );
 
// Calculate Pane width and height
pxPaneWidth pxwidth pxLeftArea pxRightArea;
pxPaneHeight pxHeight pxTopArea pxBottomArea;
 
// clalculate charting area width and height
PlotC""1styleDots );
Miny Status"axisminy" );
Maxy Status"axismaxy" );
YRange MaxY MinY;
VisBarIndex =  GetVisualBarIndex( );
NumBarsVisible StaticVarGet"NumberbarsVisible" );

// calculate conversion factors
PixelsPerBar     pxPaneWidth NumBarsVisible;
PixelsPerPrice pxPaneHeight YRange;

// For verification: Overlay pixel on price plot
FVB Status"firstvisiblebar" );
LVB Status"lastvisiblebar" );
GfxSelectPencolorRed );
for ( FVB 1<= LVB AND BarCountb++ )
{
    PrevPixelY GetYPixelsC[b-1] );
    PixelY GetYPixelsC[b] );
 
    PrevPixelX GetXPixelsVisBarIndex[b-1] );
    PixelX GetXPixelsVisBarIndex[b] );
 
    GfxMoveToPrevPixelXPrevPixelY );
    GfxLineToPixelXPixelY );
}

Edited by Al Venosa.

AFL Shapes Cheat Sheet

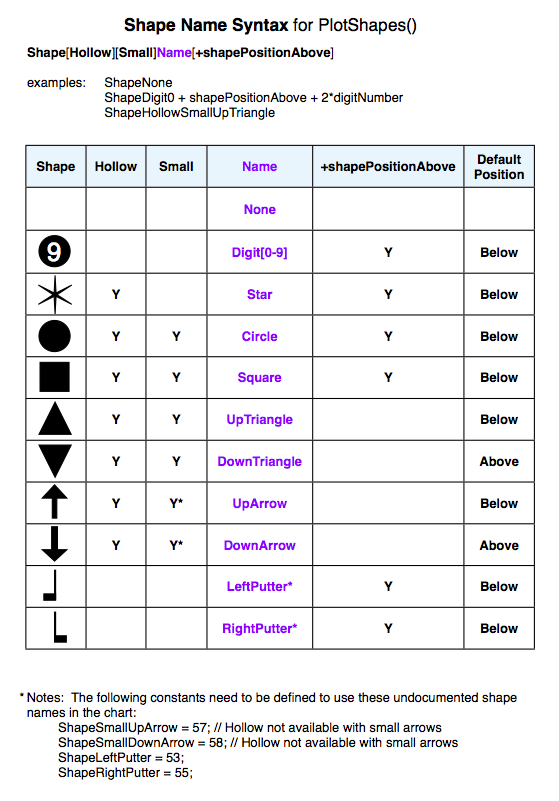
The plotshapes() can be used to plot shapes on your chart to indicate signals, stops, and other events and conditions. Figure 1 below gives a quick overview of the shapes that are available and includes a few undocumented ones. A PDF version suitable for printing is here: AFL Shapes Cheat Sheet

afl-shapes.png

Figure 1

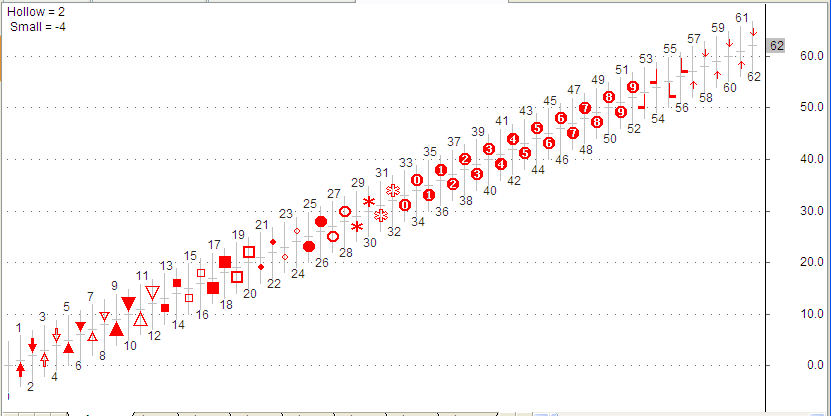
Figure 2 shows the small AFL program that was used to explore all the built-in shapes and their numerical values.

for ( 0&ltBarCounti++ )
{
    O[i] = C[i] = i;
    H[i] = 5;
    L[i] = 5;

    if ( == )  {PlotTextNumToStri1.0False ), iL[i]-2colorDarkGrey );}
    else  {PlotTextNumToStri1.0False ), iH[i]+.5colorDarkGrey );}
}
PlotShapesCcolorRed0C, -10 );
PlotC""colorLightGreystyleBar );

Title "Hollow = " NumToStrshapeHollowCircle shapeCircle0) + "\n" + 
    "Small = " NumToStrshapeSmallCircle shapeCircle0);

aflshapesf2.png

Figure 2

With additions by Herman

Finding Pixel Boundaries

Important note: The AmiBroker 5.09.0 Beta introduced the following new GFX functions:

Status(“pxchartleft”) – returns x-coordinate of top-left corner of chart area
Status(“pxcharttop”) – returns y-coordinate of top-left corner of chart area
Status(“pxchartright”) – returns x-coordinate of bottom-right corner of chart area
Status(“pxchartbottom”) – returns y-coordinate of bottom-right corner of chart area
Status(“pxchartwidth”) – returns width chart area (right-left)
Status(“pxchartheight”) – returns width chart area (bottom-top)

Since this release appeared after this post was published these functions are not used in the examples below. This post has been left unchanged for educational purposes. For examples using the new functions please see the 5.09.0 Read Me file.

=====

The first requirement when designing chart overlays and/or control panels is to know the exact dimensions of your charting pane. These are expressed in pixels. The numerical values where the margins (the four edges of your charting pane) are located depends on the resolution of your monitor, the size of the chart pane, and the fonts used to label your axis.

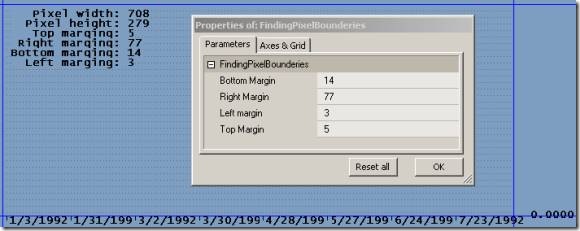
Currently the only way to obtain the values is, as far as I know, to determine the pane boundaries manually. The code below plots four lines that you can position using sliders in the Param window. When the lines fall exactly on the edges of your charting pane you can read the pixel value in the Param window and in the chart Title. See the image below and note how the blue lines hide the regular black chart frame:

clip_image002

Try changing the size of your charting pane, the overall AmiBroker window, and the font for the axis, to see how the pixel values change. Be aware that opening multiple chart panes and/or windows will also change pixel values. Also, probably to ensure that the first bar shows, the left edge of your charting pane is located at the third pixel, while actual bars start plotting at the fifth pixel. This means that trying to overlay the Blue line to determine the left boundary will be offset to the left by two pixels. To use the code below copy it to a new Indicator formula window and click Apply.

function gfxPlotHLineYPixelsColor )
{
    global pxwidth;
    GfxSelectPenColor ) ;
    GfxMoveTo0YPixels );
    GfxLineTopxwidthYPixels );
}

function gfxPlotVLineXPixelsColor )
{
    global pxheight;
    GfxSelectPenColor ) ;
    GfxMoveToXPixels);
    GfxLineToXPixelspxheight );
}

GraphXSpace 0;
SetChartOptions2chartHideQuoteMarker );

pxwidth Status"pxwidth" );
pxheight Status"pxheight" );

BottomMargin Param"Bottom Margin"140100 );
gfxPlotHLinepxheight BottomMargin);

RightMargin Param"Right Margin"770100 );
gfxPlotVLinepxwidth RightMargin);

LeftMargin Param"Left margin"30100 );
gfxPlotVLineLeftMargin);

TopMargin Param"Top Margin"50100 );
gfxPlotHLineTopMargin);

Title="\n"+
"   Pixel width: "+NumToStr(pxwidth,1.0,False)+"\n"+
"  Pixel height: "+NumToStr(pxheight,1.0,False)+"\n"+
"   Top marging: "+NumToStr(TopMargin,1.0,False)+"\n"+
" Right marging: "+NumToStr(RightMargin,1.0,False)+"\n"+
"Bottom marging: "+NumToStr(BottomMargin,1.0,False)+"\n"+
"  Left marging: "+NumToStr(LeftMargin,1.0,False);

Weekly High or Low Days

Next Page »