Moving Low Level Graphics (GFX) Objects on your Charts

When drawing gfx objects on your charts, you can move them around by applying an X and Y offset to the coordinates of the object. The following code shows a simple example of how you can move a square object around your chart.

1
2
3
4
5
6
7
8
9
10
11
12
13
14
15
16
17
18
function DrawButton( Text, x1, y1, x2, y2, BackColor )
{
    GfxSetOverlayMode( 0 );
    GfxSelectFont( "Tahoma", 12, 800 );
    GfxSelectPen( colorBlack );
    GfxSetBkMode( 1 );
    GfxSelectSolidBrush( BackColor );
    GfxSetBkColor( BackColor );
    GfxSetTextColor( 1 );
    GfxRectangle( x1, y1, x2, y2 );
    GfxDrawText( Text, x1, y1, x2, y2, 32 | 1 | 4 );
}
 
Yoffset = Param( "Button Row Offset (px)", 50, 0, 2000, 5 );
Xoffset	= Param( "Button Column Offset (px)", 50, 0, 2000, 5 );
CellHeight = Param("Cell Height",20,5,200,5);   
CellWidth = Param("Cell Width",120,5,200,5);  
DrawButton( "TEST", Xoffset, yoffset, Xoffset + CellWidth, yOffset + CellHeight, colorBlue );

If you only need to adjust the position of your object once in awhile, this simple method may serve best. However, when you want to move an object on the fly, without having to open the Param window each time, you can do this by registering the coordinates of your first click on the object and then move the object to the location of your next mouse click. The program below shows how to do this. It also shows you how to detect whether your click is within the object area (see the CursorInField variable).

To facilitate readability, the code has not been optimized. You can see in the captures below the code only adds about 4 microseconds to your execution time. It is doubtful that code optimization will have much effect on the overall execution time of your code. To test this code you Apply it to an indicator. At First Apply, it will display the Yellow Square with the word TEST in it:

clip_image002

When you click within the yellow square with your Left mouse button, it will turn Red:

clip_image004

The red color indicates that a move is in progress and that the next click will determine the location to which the object will be moved. After the move is completed, the object will return to its default yellow color:

clip_image006

In a real application, you may want to add some protective code that disables other mouse click activated actions while a move is in progress. Such code would be disabled while the object is Red and the variable MoveInProgress is true.

While the code could be (and initially was) written to move the object by holding down the Left Mouse button and dragging the object in the conventional way, the one-second minimum chart refresh rate makes this extremely awkward and slow to work with. For diagnostic purposes, a Reset button in provided in the Param window. Clicking this button will move the yellow square to its default coordinates.

1
2
3
4
5
6
7
8
9
10
11
12
13
14
15
16
17
18
19
20
21
22
23
24
25
26
27
28
29
30
31
32
33
34
35
36
37
38
39
40
41
42
43
44
45
46
47
48
49
50
51
52
53
54
55
56
57
58
59
60
61
62
63
64
65
66
67
68
69
70
71
72
73
74
75
76
77
78
79
80
81
82
83
84
85
86
87
88
89
90
91
function DrawButton( Text, x1, y1, x2, y2, BackColor )
{
    GfxSetOverlayMode( 0 );
    GfxSelectFont( "Tahoma", 12, 800 );
    GfxSelectPen( colorBlack );
    GfxSetBkMode( 1 );
    GfxSelectSolidBrush( BackColor );
    GfxSetBkColor( BackColor );
    GfxSetTextColor( 1 );
    GfxRectangle( x1, y1, x2, y2 );
    GfxDrawText( Text, x1, y1, x2, y2, 32 | 1 | 4 );
}
 
 
ParamSqrSize	= 100;
Reset = ParamTrigger( "Reset Coordinates", "RESET" );
xOffset  = StaticVarGet( "xOffset" );
YOffset  = StaticVarGet( "YOffset" );
 
if ( IsNull( xOffset ) OR IsNull( yOffset ) OR Reset )
{
    StaticVarSet( "xOffset", 20 );
    StaticVarSet( "yOffset", 20 );
    X1 = XOffset;
    Y1 = YOffset;
    X2 = XOffset + ParamSqrSize;
    Y2 = YOffset + ParamSqrSize;
    StaticVarSet( "X1", X1 );
    StaticVarSet( "X2", X2 );
    StaticVarSet( "Y1", Y1 );
    StaticVarSet( "Y2", Y2 );
    StaticVarSet( "MoveinProgress", False );
}
 
X1 = Nz( StaticVarGet( "X1" ) );
 
X2 = Nz( StaticVarGet( "X2" ) );
Y1 = Nz( StaticVarGet( "Y1" ) );
Y2 = Nz( StaticVarGet( "Y2" ) );
LButtonTrigger	= GetCursorMouseButtons() == 9;
MousePx  = Nz( GetCursorXPosition( 1 ) );
MousePy  = Nz( GetCursorYPosition( 1 ) );
 
CursorInField = MousePx > X1 AND MousePx < X2 AND MousePy > Y1 AND MousePy < Y2;
 
MoveInProgress = Nz( StaticVarGet( "MoveInProgress" ) );
 
BackColor = colorYellow;
 
if ( NOT MoveInProgress )
{
    if ( LButtonTrigger AND CursorInField )
    {
        StaticVarSet( "BackColor", colorRed );
        StaticVarSet( "DownPx1", MousePx );
        StaticVarSet( "DownPy1", MousePy );
        StaticVarSet( "MoveinProgress", True );
 
    }
}
else
    if ( LButtonTrigger )
    {
        StaticVarSet( "BackColor", colorYellow );
        DownPx1 = StaticVarGet( "DownPx1" );
        DownPy1 = StaticVarGet( "DownPy1" );
        xMove = MousePx - DownPx1;
        yMove = MousePy - downPy1;
        PrevxOffset = StaticVarGet( "xOffset" );
        PrevYOffset = StaticVarGet( "YOffset" );
        xOffset = PrevxOffset + xMove;
        yOffset = PrevYOffset + yMove;
        StaticVarSet( "xOffset", xOffset );
        StaticVarSet( "yOffset", yOffset );
        StaticVarSet( "MoveinProgress", False );
    }
 
 
BackColor = Nz( StaticVarGet( "BackColor" ), colorYellow );
 
xOffset = StaticVarGet( "xOffset" );
YOffset = StaticVarGet( "YOffset" );
X1 = XOffset;
Y1 = YOffset;
X2 = XOffset + ParamSqrSize;
Y2 = YOffset + ParamSqrSize;
StaticVarSet( "X1", X1 );
StaticVarSet( "X2", X2 );
StaticVarSet( "Y1", Y1 );
StaticVarSet( "Y2", Y2 );
DrawButton( "TEST", x1, y1, x2, y2, BackColor );

Edited by Al Venosa.

1 Star2 Stars3 Stars4 Stars5 Stars (1 votes, average: 5.00 out of 5)
Loading ... Loading ...

Restore Last Used Range v2

When starting up AmiBroker the chart range defaults to the last number of bars set in Preferences. This means that in virtually all cases you have to manually zoom and restore the chart range you were previously working with. This post presents a function that will restore the last used range before you shut down AmiBroker. If you like to use this function routinely, you can copy the functions below to your default #Include file and place this call at the top of your code:

1
RestoreLastUsedRange();

This function checks the contents of a static variable named “StartUp”+ChartIDStr. This static variable will return a NULL the first time it is called. When this happens, the ZoomToIndex() is called. This function retrieves the last used range for the current chartID from your hard disk and zooms to this range. The Plot() and Title statements are added to help you verify proper operation. You can also uncomment the two _TRACE() commands and start up DebugView for further diagnostic purposes.

If you do not have it yet, be sure to create a folder for the PersistentVariables, as shown at the top of the code. This is where the First and Last Indexes, which point to the start and end of the range being restored, are saved in a small file. You can open these with Notepad to help debugging operations.

1
2
3
4
5
6
7
8
9
10
11
12
13
14
15
16
17
18
19
20
21
22
23
24
25
26
27
28
29
30
31
32
33
34
35
36
37
38
39
40
41
42
43
44
45
46
47
48
49
50
51
52
53
54
55
56
57
58
59
60
61
62
63
64
65
66
67
68
69
70
71
72
73
74
75
76
77
78
79
80
81
82
83
84
85
86
87
88
89
90
91
92
93
94
95
96
97
98
99
100
101
102
103
104
105
106
107
108
109
//Pay attention to the double slashes in the path line. They need to be there.
 
// This creates the folder for PersistentPath variables if it doesn't exist
PersistentPath = StaticVarGetText( "~PersistentPath" );
 
if ( PersistentPath == "" ) // Ensures this folder exists
{
    PersistentPath = "PersistentVariables\\";
    fmkdir( PersistentPath );
    StaticVarSetText( "~PersistentPath", PersistentPath );
}
 
function PersistentVarGet( VarName )
 
{
    global PersistentPath;
    fh = fopen( PersistentPath + VarName + ".pva", "r" );
 
    if ( fh )
    {
        String = fgets( fh );
        fclose( fh );
    }
    else
        string = "";
 
    Number = StrToNum( String );
 
    return Number;
}
 
function PersistentVarSet( VarName, Number )
{
    global PersistentPath;
    String = NumToStr( Number, 1.3, False );
    fh = fopen( PersistentPath + VarName + ".pva", "w" );
 
    if ( fh )
    {
        fputs( String, fh );
        fclose( fh );
    }
 
    return fh;
}
 
procedure ZoomToIndex( FirstBarIndex, LastBarIndex )
{
    DT = DateTime();
    BI = BarIndex();
    FirstDateTime = LastValue( ValueWhen( FirstBarIndex == BI, DT ) );
    LastDateTime = LastValue( ValueWhen( LastBarIndex == BI, DT ) );
 
    FirstDateTimestr = DateTimeToStr( FirstDateTime );
    LastDateTimestr = DateTimeToStr( LastDateTime );
 
    AB = CreateObject( "Broker.Application" );
    AW = AB.ActiveWindow;
    AW.ZoomToRange( FirstDateTimestr, LastDateTimestr );
    //_TRACE( FirstDateTimestr +", "+LastDateTimestr );
}
 
function RestoreLastUsedRange()
{
    if ( Status( "Action" ) == 1 ) // Only perform ranging in an indicator
    {
        // is this a "start-up execution?
        ChartIDStr = NumToStr( GetChartID(), 1.0, False );
        PrevFirstBarIndex = PersistentVarGet( "FirstBarIndex" + ChartIDStr ); // Recall last positions
        PrevLastBarIndex = PersistentVarGet( "LastBarIndex" + ChartIDStr );
 
        if ( IsNull( StaticVarGet( "StartUp" + ChartIDStr ) ) )
        {
            ZoomToIndex( PrevFirstBarIndex, PrevLastBarIndex );
            StaticVarSet( "StartUp" + ChartIDStr, True );
            //_TRACE( "# StartUp Zoom: CHARTID: " + ChartIDStr + ", PrevFirstBI: " + PrevFirstBarIndex + ", PrevLastBI: " + PrevLastBarIndex );
        }
 
        // Update zoom range on disk
        FirstBarIndex = Status( "firstvisiblebarindex" );
 
        LastBarIndex = Status( "lastvisiblebarindex" );
 
        if ( PrevFirstBarIndex != FirstBarIndex OR PrevLastBarIndex != LastBarIndex )
        {
            PersistentVarSet( "FirstBarIndex" + ChartIDStr, FirstBarIndex );
            PersistentVarSet( "LastBarIndex" + ChartIDStr, LastBarIndex );
            //_TRACE( "# Update Zoom Range: CHARTID: " + ChartIDStr + ", FirstBI: " + FirstBarIndex + ", LastBI: " + LastBarIndex );
        }
    }
}
 
_SECTION_BEGIN( "RESTORE RANGE" );
 
if ( ParamTrigger( "Clear all Static Variables", "CLEAR" ) )
    StaticVarRemove( "*" );
 
Plot( C, "", 1, 128 );
 
SetBarsRequired( sbrAll, sbrAll );
 
RestoreLastUsedRange();
 
Title = "\n" +
        " ChartIDStr: " + NumToStr( GetChartID(), 1.0, False ) + "\n" +
        " FirstIndex: " + Status( "firstvisiblebarindex" ) + "\n" +
        "  LastIndex: " + Status( "Lastvisiblebarindex" ) + "\n" +
        "Selected BI: " + BarIndex();
_SECTION_END();

Edited by Al Venosa.

1 Star2 Stars3 Stars4 Stars5 Stars (5 votes, average: 4.80 out of 5)
Loading ... Loading ...

Deleting Tickers and Composites

Creating composites is a lot of fun and can provide useful information about market and sector movements. However, when creating many composites, you will sooner or later find that your database is bloated with obsolete composites. The first requirement is to create a function to delete composites. Dingo kindly provided the following example code, which will be used to provide a variety of other useful functions. Note that the functions below can be used to delete both tickers and composites; the procedure is the same. The formula is designed to be run as an indicator but can be adapted to run in a scan, etc.

Deleting a list of Tickers or Composites

1
2
3
4
5
6
7
8
9
10
11
12
DeleteTickers = ParamTrigger("Delete Tickers", "Click Here To Delete Tickers"); 
TickerList = ParamStr("Tickers to Delete","ALY,CALM,FCX,GLF,PNCL,RS,SCHN,STLD,WNR,X"); 
if ( DeleteTickers ) 
{ 
oAB = CreateObject( "Broker.Application" ); 
oStocks = oAB.Stocks(); 
for( n=0; (Ticker=StrExtract( TickerList, n))!= ""; n++) 
{ 
oStocks.Remove( Ticker ); 
} 
oAB.RefreshAll(); 
}

When testing this code be sure to use a test database to prevent deleting important tickers. It is always best to develop code that creates and deletes tickers on a test database. To test the above code create a new test database and copy-n-paste the TickerList into a Watchlist using Symbol -> Watchlist -> Type in Symbols. There is no need to backfill the tickers with data. Next open your workspace and display the Watchlist. Next, if you click Click Here To Delete Tickers, you’ll see the ticker disappearing from your Symbol Workspace.

Deleting a Single Ticker or Composite

The above code can easily be trimmed to provide a function to delete a single ticker:

1
2
3
4
5
6
7
8
9
10
11
function DeleteComposite( CompositeName ) 
{ 
oAB = CreateObject( "Broker.Application" ); 
oStocks = oAB.Stocks(); 
oStocks.Remove( CompositeName ); 
oAB.RefreshAll(); 
} 
 
DeleteTicker = ParamTrigger("Delete Ticker", "Click Here To Delete Ticker"); 
Ticker = ParamStr("Ticker to Delete","ALY"); 
if( DeleteTicker ) DeleteComposite( Ticker );

Deleting All Tickers in a Watchlist

A slight modification of the above code will let you delete all tickers in a Watchlist:

1
2
3
4
5
6
7
8
9
10
11
12
13
WatchListNum = Param("Watchlist Number",0,0,64,1); 
DeleteTickers = ParamTrigger("Delete Tickers in Watchlist", "Delete Tickers"); 
TickerList = GetCategorySymbols( categoryWatchlist, WatchListNum ); 
if ( DeleteTickers ) 
{ 
oAB = CreateObject( "Broker.Application" ); 
oStocks = oAB.Stocks(); 
for( n=0; (Ticker=StrExtract( TickerList, n))!= ""; n++) 
{ 
oStocks.Remove( Ticker ); 
} 
oAB.RefreshAll(); 
}

Deleting all Composites in Group 253

Composites are normally stored in Group 253. To delete all composites in this group replace the categorywatchlist with categorygroup:

1
2
3
4
5
6
7
8
9
10
11
12
13
GroupNum = Param("Group Nbr",253,0,255,1); 
DeleteTickers = ParamTrigger("Delete Composites", "Click Here To Delete Composites"); 
TickerList = GetCategorySymbols( categoryGroup, GroupNum ); 
if ( DeleteTickers ) 
{ 
oAB = CreateObject( "Broker.Application" ); 
oStocks = oAB.Stocks(); 
for( n=0; (Ticker=StrExtract( TickerList, n))!= ""; n++) 
{ 
oStocks.Remove( Ticker ); 
} 
oAB.RefreshAll(); 
}

OLE Code written by dingo.

1 Star2 Stars3 Stars4 Stars5 Stars (No Ratings Yet)
Loading ... Loading ...

Introduction to the ATC

The AddToComposite() (ATC) is an extremely powerful function. Topics in this category will not repeat ATC topics covered elsewhere, so be sure to follow the following links for more information and applications:

The AmiBroker AFL Reference: ADDTOCOMPOSITE
Calculating multiple-security statistics with AddToComposite function
Introduction to AddToComposite
Multiple time-frame indicators
Search this users’ Knowledge Base for applications

Also be sure to browse the applications listed at the bottom of the AFL Reference for the ATC.

1 Star2 Stars3 Stars4 Stars5 Stars (3 votes, average: 5.00 out of 5)
Loading ... Loading ...

Selected Date Range

A bar range, for processing, can be stipulated at the formula level.

The following code plots the Close, over a four month period, using the DateNum function (BarIndex can also be used in a similar way).

1
2
3
4
5
6
7
8
9
10
//P_SelectedRange 
 
///////////Plot a selected date range in the middle of chart using BarIndex or DateNum 
//Plot(IIf(BarIndex() >= 978 AND BarIndex() <= 988,C,Null),"",1,1);
Plot(IIf(DateNum() >= 1050101 AND DateNum() <= 1050430,C,Null),"",1,1); 
 
///////////Plot a selected range at the end of a chart 
LastBarIndex = LastValue(BarIndex()); 
//Plot(IIf(BarIndex() >= LastBarIndex - 10 AND BarIndex() <= LastBarIndex(),C,1)," ",8,1);
//Plot(IIf(BarIndex() >= LastBarIndex - 10,C,1)," ",8,1);

image

If the last line of code is uncommented the Close,for the last 10 bars only, will be plotted.

The formula can be adapted for use in other modes (filter, scan etc).

ATTACHED FILE:

p_selectedrange.afl

1 Star2 Stars3 Stars4 Stars5 Stars (2 votes, average: 4.00 out of 5)
Loading ... Loading ...

Abbreviated Identifiers v2

In AFL the identifiers Open, High, Low, Close, Volume, OpenInt and Avg are reserved for price field arrays. Of the small number of variables that are reserved the price identifiers are the only ones that can be abbreviated (OHLCVOI can be used instead of the longer form).

They are not case sensitive and when entered into a formula, in the Formula Editor, they will default to upper case and bold (as shown in the figure below).

image

This is very nice for speeding up formula writing but there is a ‘Catch 22′.

If abbreviated identifiers are used it makes the task of finding and replacing price arrays, using Formula Editor >> Edit >> Replace very tedious e.g. if the ‘writer’ wants to replace all “C’s” with a variable = = ParamField, for example, the Replace tool will pick up every “C” in the code and ask the user to confirm the replacement.

image

Checking Match whole word only in the Text Search Tool will change the criteria so that where “C” is part of a word it will be passed over while “C”, on it’s own, will be treated as a word and highlighted in the search report .

image

Note: The font format for reserved variables can be customized in Tools >> Preferences.

image

A handy tip for searching, with the Text Search Tool, is to position the cursor at the top of the code so that the search will begin from there. If the cursor is lower down the code the search will start from there and it will only traverse to the end before reporting that the search is complete.

1 Star2 Stars3 Stars4 Stars5 Stars (No Ratings Yet)
Loading ... Loading ...

Plotting Functions

For the syntactically challenged (is that a word?) plotting functions can provide an ‘explanation’ that can become obscure when put into words.

Here’s a silly little example.

1
2
3
/*PlotDateNum*/ 
 
Plot(DateNum(),"DateNumber",1);

Insert the formula, using daily bars, and scroll the datenum() plot using the keyboard arrows.

PlottingFunctions001

Note: The DateNum plot will display using two decimal points, by default. Ignore them as they are not relevant. They have been edited out of the image in this example.

Now turn to the AFL reference manual for comparison!

SYNTAX         datenum()

RETURNS      ARRAY

FUNCTION    Returns the array with numbers that represent quotation dates coded as follows: 10000 * (year – 1900) + 100 * month + day, so 2001-12-31 becomes 1011231 and 1995-12-31 becomes 951231

Of course, some people will prefer the latter version and some people will prefer the former, depending on their psychological typology.

1 Star2 Stars3 Stars4 Stars5 Stars (2 votes, average: 5.00 out of 5)
Loading ... Loading ...

BarCount versus BarIndex

The difference between BarCount and BarIndex can be confusing at first. Plotting can help new users ‘see the picture’.

Copy and paste the following code into the Formula Editor and save it as P_BarCount before inserting it as a chart.

1
2
3
4
5
6
7
8
9
10
/*P_BarCount*/ 
 
Plot(BarCount,"BarCount",colorBlue); 
 
Plot(BarIndex(),"BarIndex",colorBlack); 
 
Plot(Cum(1),"Cum",colorRed); 
 
BarsVisible = Status("LastVisibleBar") - Status("FirstVisibleBar");
Plot(BarsVisible,"BarsVisible",colorGreen);

Figure 1.

BarCount001

BarCount is a reserved variable. It is a constant equal to the final count of all the bars, starting from one i.e. it is a one based count equivalent to the LastValue of Cum(1).

BarsVisible has been calculated for the purpose of this demo only. It is the last bar number minus the first bar number (using a one based count). In this example BarsVisible  == 22 -1.

BarIndex() is a function that returns a progressive count of the bars starting from zero i.e. it is a zero based count. The LastValue of BarIndex() always equals BarCount -1.

Note: For this example a small database, that contains only 22 bars of data, has been used (this can be confirmed from the status bar record at the bottom of Figure 1). All of the bars are contained in the screen, and there is no need to scroll forward or back, which makes it easier to understand the behavior of BarCount and BarIndex. In practice, BarsVisible varies as the screen is zoomed in and out while Cum and BarIndex dynamically adjust to the current position of the selector line. Don’t be fooled when applying P_BarCount to larger databases as the plots of BarCount, BarIndex and Cum(1) will all dynamically adjust as the charts are scrolled or zoomed, whereas in other cases they will reference the complete database.

Figure 2.

BarCount002

BarCount and BarIndex() are not normally plotted. In other modes BarCount is referenced as a constant, while the BarIndex() number can be referenced, bar by bar, by using the subscript operator [] i.e. array identifier [expression] .

BarIndex subscript examples (from the AFL reference manual):

Close [0] represents the first available Close value.

High [BarCount -1] represents the last available High value.

Note: The BarsVisible code was copied from a YahooGroup discussion on ‘How to determine the number of visible bars on a chart’ at  AmiBrokerYahooGroup message #114546

ATTACHED FORMULA FILE: P_BarCount.afl

  • To download .afl files right click on the link and pick Save Target As. Then enter Program Files/AmiBroker/Formulas/Custom as the path to access them from within AmiBroker > View > Charts. 
  • Written using AmiBroker Standard Edition v4.9 and Yahoo!Finance EOD data.

1 Star2 Stars3 Stars4 Stars5 Stars (7 votes, average: 4.57 out of 5)
Loading ... Loading ...

Introduction to AFL

The AmiBroker Programming Language (AFL) is a very unique and powerful programming language but to use it effectively you have to understand how it works and how to properly use the AFL functions. For the newcomer to programming, this may represent a steep learning curve and it may take a little persistence to find the answers to all your questions. To write documentation on any topic that leaves no questions unanswered is an impossible task, all help documentation assumes a minimum level of familiarity with the topic studied. The problem is that this prerequisite minimum level of understanding is set by the subjective judgment of the author. The results is that, for the individual user, some topics are covered excessively while others are skimmed over because the author assumed that everybody is basically familiar with the topic. Users on the other hand often assume that their lack of knowledge is shared by all beginners and, if the Help file inadequately explains something, claim that the documentation is badly written. Of course their view is just as relative and subjective as those of the author.

This situation exist in various degrees in all documentation and cannot be prevented. The way for you to cope with this is to stay calm (there have been some heated posts on the lists) and do your own research research. If you still can’t understand something and/or can’t find the answer to your specific question you can email AmiBroker Technical Support for help or post your question on one of the AmiBroker forums:

Amibroker Users’ Group
AmiBroker Automated-Trading
AmiBroker Trading Systems
AmiBroker AFL

There are some other Yahoo forums you may want to look at, especially if you are multilingual. For a more general search targeting groups in any language click here.

If you believe your question is of general interest you can ask your question using the comment field below. But please be specific; questions like ‘How do I use AFL’ would require a book to answer and is way beyond the scope of what volunteers can contribute.

Of course we welcome your solutions to specific AFL problems, either as an author with a post (requires registration) in this category, or in the comment field below.

1 Star2 Stars3 Stars4 Stars5 Stars (1 votes, average: 5.00 out of 5)
Loading ... Loading ...

Zoom-to-Range Applications

This post offers a variety of zoom functions to help you analyze charts better. For example, you can zoom in on the cursor-selected bar, or you can step forward and backward from signal to signal or over custom price conditions. These functions are made possible by the ZoomToRange OLE function, which lets you zoom in on a specific date range.

To exercise and test the functions below, copy and Insert the code to an Indicator pane, open the Param window, and click on various options to see how the functions work. For demo purposes, three zoom events are provided: Buy, Sell, and Mondays. In your own application, you would assign other conditions to the event variable, such as, for example, gaps, price patterns, etc. Stepping from Event to Event would allow you to visually analyze the chart surrounding events. The Param window looks like this:

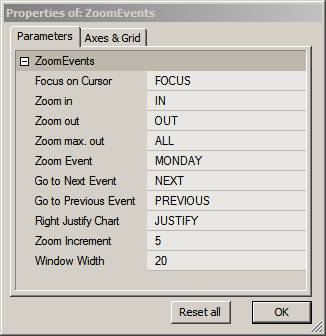
Zoom Increment is the number of bars added to the display with each zoom in/out action. WindowWidth is the number of bars displayed when jumping from event to event.
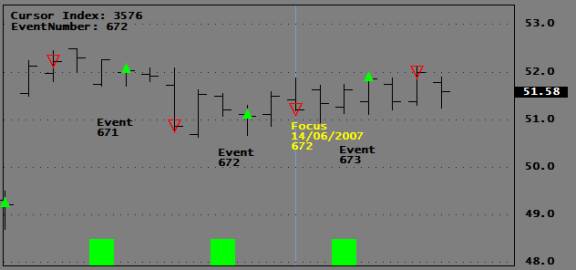
The program uses a FocusBar to which zoom dimensions are referenced. Yellow text is attached to the FocusBar on the chart to identify it. You can add other information to this PlotText(). For example, if you were analyzing buy, sell, short, and cover signals, you could add trade prices and indicator values, if you so desired. The Green histogram at the bottom of the chart indicates where the selected events occur. See an example chart below showing buy signals. The green histogram bar occurs just before the green buy arrow on the chart.

Descriptions for the function below are presented ahead of the functions themselves so that you can copy all the code in one step.

ZoomToIndex( FirstBarIndex, LastBarIndex)
Calling the ZoomToIndex() will zoom your chart to display a window ranging from the first argument (FirstBarIndex) to the second argument (LastBarIndex). While you cannot zoom in closer than ten bars using the Zoom In/Out buttons on your AB Toolbar, this function lets you zoom all the way down to a two-bar window. Since most Indicators use periods expressed in bars and not in dates, the function uses the BarIndex to set the window width.

ZoomToCursor( ZoomWidth )
This function lets you zoom in to the cursor position and display the number of bars assigned to ZoomWidth. The values of important variables are displayed in the chart Title for educational purposes.

ZoomOut( ZoomWidth )
This function zooms out by increasing the number of bars displayed by ZoomWidth bars.

ZoomIn( ZoomWidth )
This function zooms in by reducing the number of bars displayed by ZoomWidth bars.

ZoomToNext( Event, ZoomWidth )
This function lets you jump to the next occurrence of a TRUE value in the Event Array. It also focuses on the event with a window of ZoomWidth bars. The most important application for this function would probably be to analyze trades by stepping from signal to signal and to visually inspect custom events or price patterns.

ZoomToPrev( Event, ZoomWidth )

This function is similar to the one above, but it jumps (retreats) to the previous event.

MarkFocus()
This function places the Yellow text at the FocusBar. You may want to customize the text displayed.

ZoomAllOut()
This function zooms out to display all bars in the database.

RightJustifyChart
When trading Real-Time, your signals are generated by prices from the Last Bar whether this bar is visible or not. If, during intense trading, you miss the fact that your Chart is not fully right justified, you may see and hear orders going out while no actions show on your Chart. While such confusion usually doesn’t last long, it could delay discretionary trades and even trick you into thinking there may be a coding problem, causing you to initiate debugging code. This function right-justifies your chart, and if it is triggered at the start of your session, it will prevent you from working with a shifted chart.

1
2
3
4
5
6
7
8
9
10
11
12
13
14
procedure ZoomToIndex( FirstBarIndex, LastBarIndex)
{
StaticVarSet("FirstBarIndex",FirstBarIndex);
StaticVarSet("LastBarIndex",LastBarIndex);
DT = DateTime();
BI = BarIndex();
LastDateTime = LastValue(ValueWhen( LastBarIndex == BI, DT ));
FirstDateTime = LastValue(ValueWhen( FirstBarIndex == BI, DT ));
LastDateTimestr = DateTimeToStr( LastDateTime );
FirstDateTimestr = DateTimeToStr( FirstDateTime );
AB = CreateObject("Broker.Application");
AW = AB.ActiveWindow;
AW.ZoomToRange( FirstDateTimestr, LastDateTimestr );
}
1
2
3
4
5
6
7
8
9
10
11
procedure ZoomToCursor( ZoomWidth )
{
local ZoomWidth;
BI = BarIndex();
SBI = SelectedValue(BI);
LBI = LastValue(BI);
CursorIndex= Nz(StaticVarGet("CursorIndex"));
FirstBarIndex = Max(0,SBI - ZoomWidth);
LastBarIndex = Min( LBI, SBI + ZoomWidth );
ZoomToIndex( FirstBarIndex, LastBarIndex);
}
1
2
3
4
5
6
7
8
9
10
11
procedure ZoomOut( ZoomWidth )
{
local ZoomWidth;
BI = BarIndex();
LBI = LastValue(BI);
LastVisiblebar = Status("LastVisibleBar");
FirstVisibleBar= Status("FirstVisibleBar");
FirstBarIndex = Max( 0, FirstVisibleBar - ZoomWidth);
LastBarIndex = Min( LBI, LastVisibleBar + ZoomWidth );
ZoomToIndex( FirstBarIndex, LastBarIndex);
}
1
2
3
4
5
6
7
8
9
10
11
12
procedure ZoomIn( ZoomWidth )
{
local ZoomWidth;
_TRACE("##");
BI = BarIndex();
LBI = LastValue(BI);
LastVisiblebar = Status("LastVisibleBar");
FirstVisibleBar= Status("FirstVisibleBar");
FirstBarIndex = Max( 0, FirstVisibleBar + ZoomWidth);
LastBarIndex = Min( LBI, LastVisibleBar - ZoomWidth );
ZoomToIndex( FirstBarIndex, LastBarIndex);
}
1
2
3
4
5
6
7
8
9
10
11
12
13
14
15
procedure ZoomToNext( Event, ZoomWidth )
{
local Event, Zoomwidth;
EventNum = Cum(Event);
BI = BarIndex();
LBI = LastValue(BI);
DT=DateTime();
NextEventNum = Min(Nz(StaticVarGet("EventNumber"))+1, LastValue(EventNum));
NextEventIndex = LastValue(ValueWhen(EventNum == NextEventNum, BI));
StaticVarSet("EventNumber",Max(1, NextEventNum));
FirstBarIndex = Max( 0, NextEventIndex - ZoomWidth );
LastBarIndex = Min( BarCount-1, NextEventIndex + ZoomWidth);
ZoomToIndex( FirstBarIndex, LastBarIndex);
StaticVarSet("FocusIndex",NextEventIndex);
}
1
2
3
4
5
6
7
8
9
10
11
12
13
14
15
procedure ZoomToPrev(  Event, ZoomWidth )
{
local Event, Zoomwidth;
EventNum = Cum(Event);
BI = BarIndex();
LBI = LastValue(BI);
LastEventNum = LastValue(EventNum);
NextEventNum = Max(1,Nz(StaticVarGet("EventNumber"))-1);
NextEventIndex = LastValue(ValueWhen(EventNum == NextEventNum, BI,1));
StaticVarSet("EventNumber",NextEventNum);
FirstBarIndex = Max( 0, NextEventIndex - ZoomWidth );
LastBarIndex = Min( BarCount-1, NextEventIndex + ZoomWidth);
ZoomToIndex( FirstBarIndex, LastBarIndex);
StaticVarSet("FocusIndex",NextEventIndex);
}
1
2
3
4
5
6
7
8
9
10
11
12
procedure MarkFocus()
{
global EventNum;
DT=DateTime();
BI = BarIndex();
LBI = LastValue(BI);
FirstBarIndex = Nz(StaticVarGet("FirstBarIndex"));
FocusIndex = Min(LBI,Nz(StaticVarGet("FocusIndex"))+1);
FocusDateStr = NumToStr(DT[FocusIndex],formatDateTime);
ENStr = NumToStr(EventNum[FocusIndex],1.0,False);
PlotText("\n\nFocus\n"+FocusDateStr+"\n"+ENStr,FocusIndex,C[FocusIndex],colorYellow);
}
1
2
3
4
5
6
7
8
procedure ZoomAllOut()
{
BI = BarIndex();
LBI = LastValue(BI);
FirstBarIndex = 0;
LastBarIndex = LBI;
ZoomToIndex( FirstBarIndex, LastBarIndex);
}
1
2
3
4
5
6
7
8
9
10
11
procedure RightJustifyChart( ChartWidth )
{
DT = DateTime();
BI = BarIndex();
FirstDateTime = LastValue( Nz(Ref( DT,-Max(2, ChartWidth) ) ) );
FirstDateTimestr = DateTimeToStr( FirstDateTime );
LastDateTimestr = DateTimeToStr( LastValue(DT) );
AB = CreateObject("Broker.Application");
AW = AB.ActiveWindow;
AW.ZoomToRange( FirstDateTimestr, LastDateTimestr );
}
1
2
3
4
5
6
7
8
9
10
11
12
13
14
15
16
17
18
19
20
21
22
23
24
25
26
27
28
29
30
31
32
33
34
35
36
37
38
39
40
41
42
43
44
45
46
47
48
49
50
51
52
53
54
55
56
57
58
59
60
61
62
63
64
65
66
67
68
69
70
71
72
73
74
75
76
77
78
79
80
81
82
83
84
85
86
87
88
89
90
91
92
93
94
95
SetBarsRequired(1000000,1000000);
GraphXSpace = 20;
_SECTION_BEGIN("ZOOM");
FocusTrigger= ParamTrigger("Focus on Cursor","FOCUS");// zoom out by ZoomIncrement
ZoomInTrigger= ParamTrigger("Zoom in","IN");// zoom in by ZoomIncrement
ZoomOutTrigger= ParamTrigger("Zoom out","OUT");// zoom in by ZoomIncrement
ZoomAllTrigger = ParamTrigger("Zoom max. out","ALL");// zoom out to all bars
ZoomPrevTrigger= ParamTrigger("Go to Next Event","NEXT");// Jump to next event
ZoomNextTrigger= ParamTrigger("Go to Previous Event","PREVIOUS");// Jump to previous event
RJTrigger= ParamTrigger("Right Justify Chart","JUSTIFY");
ZoomIncrement= Param("Zoom Increment",10,1,1000,2);
ZoomWidth= Param("Window Width",20,2,1000,1);
_SECTION_END();
_SECTION_BEGIN("TEST SIGNALS");
ZoomEvent= ParamList("Zoom Event","MONDAY|RSI-BUY|RSI-SELL|TARGET",1);// Test events
ProfitTarget= Param("Profit Target",0.1,0,2,0.01);// Profit target
_SECTION_END(); 
 
PrevZoomWidth= Nz(StaticVarGet("ZoomWidth"));
ZoomChange= PrevZoomWidth != ZoomWidth; 
StaticVarSet("ZoomWidth",ZoomWidth); 
 
ZoomAction = FocusTrigger OR ZoomOutTrigger OR ZoomAllTrigger OR ZoomNextTrigger OR ZoomPrevTrigger OR ZoomChange OR ZoomInTrigger OR RJTrigger; 
 
if( ZoomEvent == "MONDAY" ) Event = DayOfWeek() == 1;
else if( ZoomEvent == "RSI-BUY" ) 
{ 
Event = Cross(30,RSI());// Buy rule to investigate
PlotShapes(IIf(Event,shapeSmallUpTriangle, shapeNone),5,0,C,0);
Sell = 0; 
}
else if( ZoomEvent == "RSI-SELL" ) 
{ 
Event = Cross(RSI(),70);// sell rule to investigate 
PlotShapes(IIf(Event,shapeHollowDownTriangle, shapeNone),4,0,C,0);
Buy = 0; 
}
else if( Zoomevent == "TARGET" ) 
{
Target = Ref(C,1) - C;// Profit target to analyze
Event = Target > ProfitTarget;
PlotShapes(IIf(Event,shapeSmallUpTriangle, shapeNone),5,0,C,0);
}
else Event = 0; 
 
Plot(C,"",1,128);
EventNum = Cum(Event);
FVBI = Status("FirstVisibleBarIndex");
LVBI = Status("LastVisibleBarIndex");
BI = BarIndex();
SBI = SelectedValue(BI);
LBI = LastValue(BI); 
 
FirstVisibleBar = Status( "FirstVisibleBar" );
Lastvisiblebar = Status("LastVisibleBar");
for( b = Firstvisiblebar; b < Lastvisiblebar AND b < BarCount; b++)
{
if( Event[b] ) PlotText("\n\n\n\nEvent\n"+NumToStr(EventNum[b],1.0,False),b,L[b],1);
} 
 
if( GetCursorMouseButtons() == 1 ) 
{
StaticVarSet("CursorIndex",SBI);
EventNum = Cum(Event);
StaticVarSet("EventNumber",SelectedValue(EventNum));
StaticVarSet("FocusIndex",SBI-1);
}
CursorIndex= Nz(StaticVarGet("CursorIndex")); 
 
if( ZoomAction )
{
CurrentRange= LastVisiblebar-FirstVisibleBar;
VisibleCenter= int((LastVisibleBar + FirstVisibleBar)/2);
PrevEventIndex = LastValue(ValueWhen(Event,BI,1));
NextEventIndex = LastValue(ValueWhen(Event,BI,-1));
FirstBarIndex = Nz(StaticVarGet("FirstBarIndex"));
LastBarIndex = Nz(StaticVarGet("LastBarIndex")); 
 
if( FocusTrigger) ZoomToCursor( ZoomWidth );
else if( ZoomInTrigger ) ZoomIn( ZoomWidth );
else if( ZoomOutTrigger ) ZoomOut( ZoomWidth );
else if( ZoomNextTrigger ) ZoomToPrev( Event, ZoomWidth );
else if( ZoomPrevTrigger ) ZoomToNext( Event, ZoomWidth );
else if( ZoomAllTrigger ) ZoomAllOut();
else if( RJTrigger ) RightJustifyChart( ZoomWidth );
} 
 
MArkFocus(); 
 
Plot(Event,"",5,styleArea|styleOwnScale|styleNoLabel,0,10);
CursorIndex = StaticVarGet("CursorIndex");
EventNumber= StaticVarGet("EventNumber");
Title = "\n"+
"Cursor Index: "+NumToStr(CursorIndex,1.0,False)+"\n"+
"EventNumber: "+NumToStr(EventNumber,1.0,False)+"\n";

Edited by Al Venosa

1 Star2 Stars3 Stars4 Stars5 Stars (11 votes, average: 4.55 out of 5)
Loading ... Loading ...
« Previous PageNext Page »