September 23, 2007
Measuring AFL Execution Times (v3)
When your code increases in complexity, it will start to execute more slowly, and you will eventually reach a point where you will want to optimize your code for speed of execution. Even if you are willing to buy a faster computer, it will rarely give you a greater speed advantage than optimizing your code.
Important note: The AmiBroker 5.01.1 beta released on 5/10/2007 offers a new profiling function that enables you to get accurate performance timing for all AmiBroker and custom functions called. It is available from the AFL Editor: Tools -> Code Check and Profile menu. To use this new tool effectively you should convert your code modules to function calls as much as possible. Try it!
The first requirement for analyzing your AFL execution speed is the ability to measure the execution times. This is best done using the GetPerformanceCounter(), which gives microsecond resolution. You can display the execution time in the chart Title, or log them to DebugView. To get an appreciation of how fast AFL executes you may want to time a few of your most frequently used AFL statements. As Tomasz pointed out in his comment to an earlier version of this post, this can be done using a simple loop:
<p>On my 2GHz laptop, the Param() takes about 4 microseconds to execute. The "Statement under test" can be any AFL statement or section of code you want to analyze. This simple code will give you a fairly accurate idea of the true execution time. Please do not forget that all programs executing under Microsoft Operating Systems are subject to interruptions. This means that your readings may fluctuate and will generally be greater than their absolute true values. Your normal program executions are also subject to these interruptions and, if you perform precision timing tasks, your should consider their effect.</p> <p>If, in view of processing overhead, you prefer not to use DebugView, you can log execution times either to the Interpretation screen, which invokes an additional AFL execution, or to the chart Title if you output just a few measurements. Use of DebugView is outlined in several posts in the <a href="http://www.amibroker.org/userkb/category/real-time-auto-trading/debugging-afl/">Debugging AFL</a> category. When you are logging to DebugView, execution times will be inflated by the amount of time needed to call and execute the _Trace() functions. You can measure the timing overhead for a single _Trace() function using the same method we used above:</p> <p>On my 2GHz laptop, the _Trace() takes about 35 microseconds to execute. Compared to the Param(), this would appear like a major error, but in practice it is not. For example, when calling the _Trace() function thirty times in your code, this would add only about 1 millisecond to the overall execution time of your program. </p> <p>The example code below logs to DebugView and to the chart Title. It uses a small Trace() function that is called each time you want to log a timing measurement. You can customize this function to log additional information. Although you can call this function on each line, you do not have to. Calling Trace() introduces a small measurement error. This means that when you remove the measurement code, performance should be slightly better than your measurements predict. If you do not use DebugView, you can delete all DebugView related statements. If you do this, I suggest you comment them out until your modified code has been verified.</p> <p>Be careful when calling the Trace() from inside a loop. If your loop steps through 50,000 bars of data, inserting one or more Trace() calls will slow down your code substantially and result in a significant measurement error. The key to reasonable accuracy is to use the minimum number of _Trace() statements and keep them out of loops and frequently called functions.</p> <p>Inserting/removing TRACE() statements in a test program is easily done using the Edit- Replace function in the formula editor. To add _Trace() statements, replace the ";" at the end of the line with "; TRACE("");":</p> <p align="center"><img height="178" src="http://www.amibroker.org/userkb/wp-content/uploads/2007/09/clip-image0023.jpg" width="351" border="0"></p> <p>To remove the _Trace() statements substitute "; TRACE("");" with ";":</p> <p align="center"><img height="178" src="http://www.amibroker.org/userkb/wp-content/uploads/2007/09/clip-image0043.jpg" width="351" border="0"></p> <p>Place your cursor just before the last ";" that precedes the first line of code you want to time. Stop substitutions where you no longer want to time statements. You should initialize the LineNumber to the line number that contains your first Trace() statement. Line numbers for your cursor position are displayed at the right bottom of your editor screen.</p> <p>Here is a do-nothing program where _Trace() statements were added using the above method. You can modify the function Trace() to output any information you like: <p>function Trace( Comment )</p> <p>{</p> <p>global LineNumber, TitleStr;</p> <p>PC = GetPerformanceCounter( True );</p> <p>Str = "# LN: "+NumToStr(LineNumber++,1.0,False)+", PC: "+NumToStr(PC,9.3)+" mSec., "+Comment;</p> <p>TitleStr = TitleStr + Str+"\n";</p> <p>_TRACE(Str);</p> <p>}</p> <p>
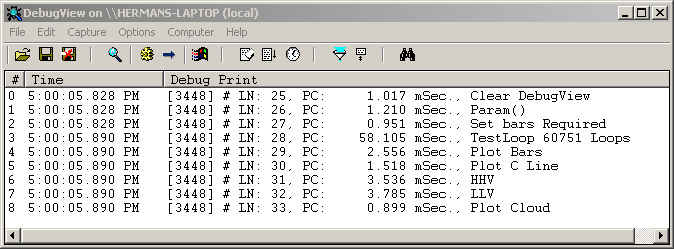
The output produced in DebugView looks like this:
The output in the Title looks like this:
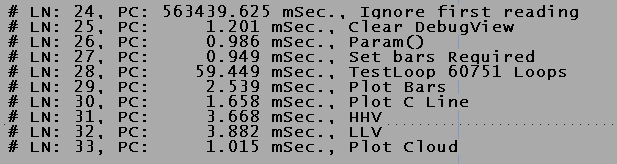
The first reading in the Title should be ignored as it initializes the PerformanceCounter. This reading is suppressed by the DBViewClear command in the DebugView log. The above method can be used to determine execution times of all AFL functions. Note that in the above example SetBarsRequired() is used to process all available data. This would be the worst-case measurement. Commenting out SetBarsRequired() will make your code execute under Quick-AFL. This may be significantly faster than running over all data.
Measuring Execution Order and Timing for Window Panes
When you are executing AFL formulas in multiple panes or windows and experience a timing problem, the first step to take, before using the above method, is to determine which pane uses up too much time. You can turn on Tools -> Preferences ->Miscelaneous -> Display Chart Timing to read the execution time at the bottom of the charts. Alternatively, the simple code below lets you log the execution order and time for the formulas in each open pane to DebugView. Since the AmiBroker Performance Counter readout is unique for each pane, the code below does not use it. In this case you will have to turn on Options -> Show Milliseconds in DebugView. This will give you Millisecond resolution, not micro-second as with the performance Counter and is a very approximate measurement. It should only be used to identify the problem formula. The execution order of the panes is revealed by the order in which the lines appear in the DebugView.
Filename = StrLeft(_DEFAULT_NAME(),StrLen(_DEFAULT_NAME())-2);
function TraceChartID()
{
Msg = "# ChartID, "+NumToStr(GetChartID(),1.0,False)+", "+Filename;
_TRACE( Msg );
return Msg;
}

TraceChartID();

//
for(n=0; n<BarCount;n++) ; // your code would be here
//

Title = TraceChartID();
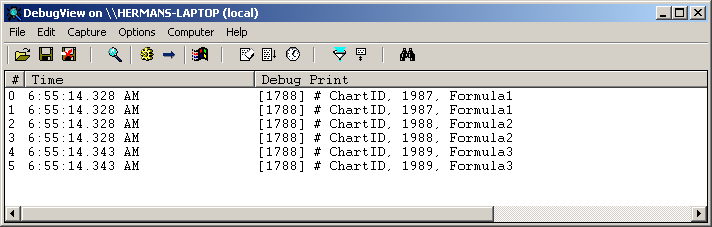
The Filename assignment and the TraceChartID() should be placed at the very top of your code, or you can add it to your default Include file. The single line used to call this function should be placed at both the beginning and the end of the code in each window/pane. This is what it looks like in DebugView:
Edited by Al Venosa.
 Filed by Herman at 3:44 pm under Real-Time AFL Programming
Comments Off on Measuring AFL Execution Times (v3)