October 22, 2007
MACD Trend System
I use a small setup criteria to scan for my stocks.
Settings:
MACD default,
I look for Histogram 4 down bars and 1 up bar for buy signal(I have the histogram set to red for down and blue for up so I can see
clearly).
MACD above Zero Line
RSI Above 30
This system is base on trend trading. Buying on pullback when the market continues its up trend.
To scan for MACD Trend setups:
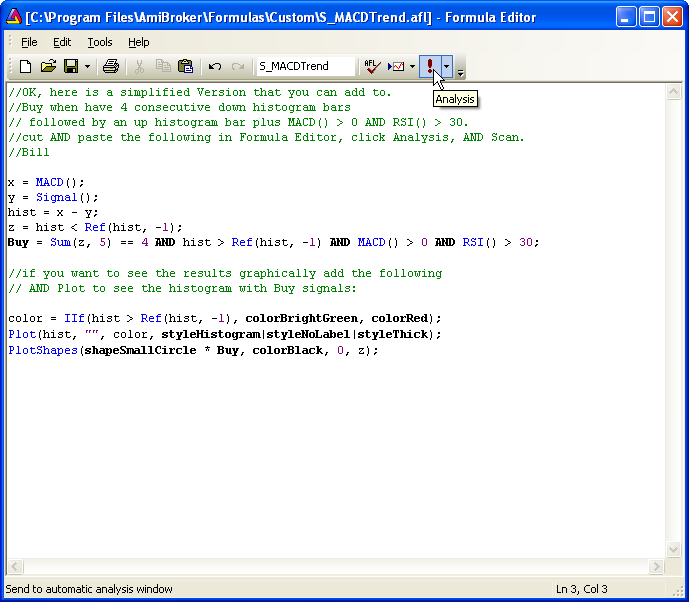
1) Insert the following formula into a chart.
2) Run a Scan in AA using S_MACDTrend with All symbols, n last days, n = 1 and Sync chart on select as the settings.
Stocks that meet the criteria will be reported in the Results list.
Note: Some variations of the setup rules can define signals that are quite rare and in small databases it is possible that there will be no setups on any given day (hence no stock will be reported by the scan).
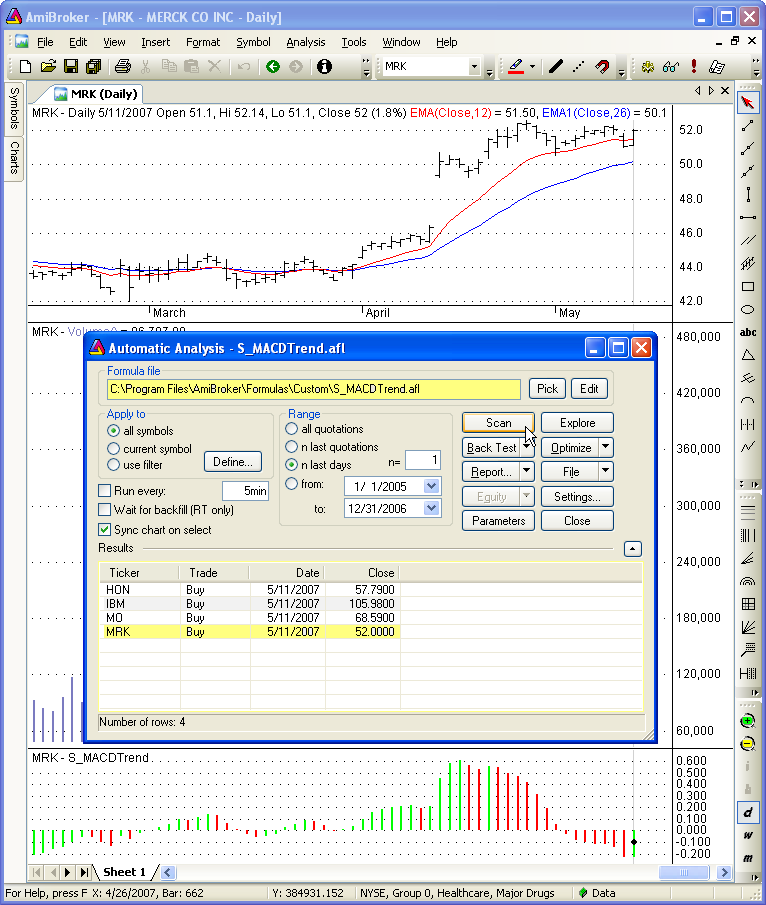
3) Click on any symbol in the Results pane to view the chart, for that symbol, in the background.
Note: In this example a training database, that only contains data up to 5/11/2007, was used.
- Trading idea by protraderinc.
- Comments and formula by Bill – WaveMechanic.
AmiBrokerYahooGroup message #116233 “MACD Histogram” http://finance.groups.yahoo.com/group/amibroker/message/116233
 Filed by brian_z at 11:06 pm under Ideas (Experimental)
Comments Off on MACD Trend System