October 14, 2011
EOD Gap-Trading Portfolio system
Added February 29, 2012, additional points to consider:
1) This system depends on getting accurate fills at the Open price. To obtain such fills requires a quality minimum-delay data feed and advanced programming skills to implement trade-automation.
2) When setting the entry price slightly below the Open price (trying to improve performance) the system fails miserably. Even improving the price by just one cent kills the system. This suggests that most of the profit comes from days on which the Open price was equal to the daily Low, i.e., the price moved up from the Open and never dropped below it. This, of course, is obvious. To confirm this I added this test condition (it looks ahead) to exclude days on which Open == Low:
Buy = Buy AND NOT O == L;
This kills the system and proves that most of the profit comes from days where O==L. To further confirm this I added the opposite condition:
Buy = Buy AND O == L;
This gives nearly infinite profits and proves that most profits come from days on which the price moves up immediately from the Open and never returns below it. Trying to improve the entry price is a mistake; one should enter on a Stop set 1-2 ct above the Open price, this will eliminate days when the price drops and never turns back. This improves performance significantly.
3) This system trades knee-jerk trader-responses/patterns. Such patterns are usually drowned by large volume trading hence this system works far better when you select tickers with volumes between 500,000 and 5,000,000 shares/day. This also improves performance significantly.
Adding the above two features results in an equity curve much better than that shown below. Sorry, I have no time to document the above in greater detail. Good luck!
The original post:
This post outlines a very simple Long-only trading idea that Buys at a given percentage below yesterday’s Low, and exits at the next day’s Open. While sometimes it may be difficult to get the exact Open price, the high profitability of this system makes it a good candidate for further experimentation. The system works well with Watchlists like the N100, SP500, SP1500, Russel 1000, etc. Performance on the Russel 1000, with max. open positions set to 1, for the period 12/10/2003 to 12/10/2011, looks like this:


Some of the other Watchlists give less exposure (profits) but this comes with lower DDs. Commissions were set to $0.005 per share. No margin used.
No explicit ranking is used; tickers are traded based on their alphabetical sort in the Watchlist. This may seem odd but is significant: reversing this sort the system fails. This might mean that, due to real-time scanning problems, symbols listed at the top of this sort may be traded differently than those listed at the bottom.
Pay attention to Liquidity (you might want to trade more than one position) and slippage (Entry is rather risk-free, but exits may be problematic). DDs are significant but may be offset with improved real-time traded entries and exits. When trading automatically it may be possible to place OCA DAY-LMT entry orders for all signals and just wait and see what fills. Since exits are more difficult than entries you may wish to explore other exit strategies.
Parameter default values are just picked out of a hat. Almost certainly you can Optimize them or adjust them dynamically for individual tickers. I briefly tested this system in Walk-Forward mode and the results were profitable for all years tested. Except for the number of stocks traded parameters appear not very critical. Over-optimizing doesn’t seem a problem in this case.
The code below is very simple and requires few explanations. However it is important to understand that this system enjoys a small edge by trading at the Open, and by calculating the TrendMA using the same Open price. Some might interpret this as future leak, however if you trade this system in real-time, it is not. Many people do not realize that if you trade at the Open you can also use this price in your calculations — as long as you perform them in real-time — this is where AmiBroker and technology can give you an edge. If you Ref() back the TrendMA by one bar the system is still very profitable however DDs increase for some Watchlists. If you use fixed investments the difference is negligible.
The trading procedure would be to start scanning before the market opens and remove tickers that are priced so remote that they are unlikely to meet the OpenThresh. Thus you may start scanning 1000 symbols but very quickly the number scanned will dwindle to just a dozen or so tickers. When you approach 9:30am your real-time scan will be very fast and you will be able to place your LMT order very close to the Open – you may even be able to improve on the Open price.
Even though a few people looked at the code below and found nothing wrong, the profits seem rather high for such a simple system. Please report errors you may see.
function ParamOptimize( description, defaultVal, minv, maxv, step )
{
    return Optimize( description, Param( description, defaultVal, minv, maxv, step ), minv, maxv, step );
}

PosQty = ParamOptimize( "Position Qty", 1, 1, 10, 1 );
TrendPeriod = Paramoptimize( "Pd1", 13, 3, 30, 1 );
OpenOffset = paramOptimize( "OS", 0.99, 0.98, 1, 0.001 );
MinVolume = ParamOptimize( "Min. Volume (M)", 0.5, 0.5, 10, 0.5 );

Short = Cover = 0;
SetOption( "allowsamebarexit", False );
SetOption( "maxopenpositions", PosQty );

VolumeOK = MA( Ref( V, -1 ), 10 ) > MinVolume;
TrendMA = MA( O, TrendPeriod );
ROCTrend = ROC( TrendMA, 1 );
TrendUp = ROCTrend > 0;
OpenThresh = Ref( L, -1 ) * OpenOffset;

Buy = O < OpenThresh AND VolumeOK AND TrendUp;
BuyPrice = O;

Sell = Ref( Buy, -1 );
SellPrice = O;

PositionSize = -100 / PosQty;  // Compounded
//PositionSize = 100000;   // Fixed investment

Plot( C, "", 1, 128 | styleThick );
Plot( TrendMA, "", 2, 1 );

if ( ParamToggle( "Triangles", "HIDE|SHOW", 1 ) )
{
    PlotShapes( IIf( Buy,     shapeSmallCircle, shapeNone ), 5, 0, BuyPrice, 0 );
    PlotShapes( IIf( Sell,    shapeSmallCircle, shapeNone ), 4, 0, SellPrice, 0 );
}
 Filed by Herman at 7:03 pm under Ideas (Experimental)
Comments Off on EOD Gap-Trading Portfolio system
September 1, 2011
A Long-only EOD Gap trading idea
This idea was posted ( #161332 ) on the main AmiBroker list on July 3, 2011. There were numerous excellent comments on the list and if you are interested in working on this system you do well to read them all before starting. After posting I found a number of posts on the web discussing this trading idea, some claimed to be trading a similar system with good success.
I referred to this system a “Gap Trading” system but this may be a bit of a misnomer, “Mean reversion” might be a better classification. Googling for it will get you many more hits to similar systems. Here are a few links:
NDX100: Trading intraday mean reversion using limit orders
Trading intraday mean reversion using limit orders – does it work?
It appears to be a fairly widely discussed trading idea and I suggest you’ll do some Googling on your own to learn the latest. As an Amibroker user you have better tools than most traders and you have a better chance than most to come up with a variation that works. Perhaps with a little less profits, and with a significant amount of additional code — it won’t be a “quicky” project :-)
Some people commented that this system will not work in real trading, while they may be right others say schemes like this work. I didn’t finish the system and can’t claim to know whether it is tradable or not.
The system Buys at a certain percentage below yesterday’s Low, on a LMT order, and exits in the same day at the Close.

Short = Cover = 0;
Qty = 6;
SetTradeDelays( 0, 0, 0, 0 );
SetOption( "AllowSameBarExit", True );
SetOption( "maxopenpositions", Qty );

GapAmount = Param( "Gap (%)", 1.5, 0, 3, 0.01 );
BuyPrice = ( 1 - GapAmount / 100 ) * Ref( L, -1 );
BuyPrice = Min( O, BuyPrice ); // Enter immediately at Open if below BuyPrice
Buy = L < BuyPrice AND Ref( MA( V, 10 ), -1 ) > 1000000;
SellPrice = C;
Sell = Buy;

// To test for ticker-sensitivity turn on Random Ticker Selection
// and run this code in the Optimizer to see how performance varies
// Because it is unknown which ticker will trigger first actual
// performance will be somewhere between the min/max profits shown

if ( ParamToggle( "Random Ticker Selection", "OFF|ON", 0 ) )
{
    Optimize( "Dummy", 1, 1, 100, 1 );
    PositionScore = mtRandom();
}

PositionSize = -100 / Qty;

Plot( C, "", 1, 128 );

if ( ParamToggle( "Arrows", "HIDE|SHOW", 0 ) )
{
    Equity( 1 );
    PlotShapes( IIf( Buy, shapeUpArrow, shapeNone ), colorGreen, 0, BuyPrice );
    PlotShapes( IIf( Sell, shapeDownArrow, shapeNone ), colorRed, 0, SellPrice );
    PlotShapes( IIf( Buy, shapeSmallCircle, shapeNone ), colorGreen, 0, BuyPrice, 0 );
    PlotShapes( IIf( Sell, shapeSmallCircle, shapeNone ), colorRed, 0, SellPrice, 0 );
}
Filed by Herman at 6:53 pm under Ideas (Experimental)
Comments Off on A Long-only EOD Gap trading idea
November 28, 2007
Inverse Return To Mean System
Filed by brian_z at 11:54 pm under Ideas (Experimental)
Comments Off on Inverse Return To Mean System
October 22, 2007
MACD Trend System
I use a small setup criteria to scan for my stocks.
Settings:
MACD default,
I look for Histogram 4 down bars and 1 up bar for buy signal(I have the histogram set to red for down and blue for up so I can see
clearly).
MACD above Zero Line
RSI Above 30
This system is base on trend trading. Buying on pullback when the market continues its up trend.
To scan for MACD Trend setups:
1) Insert the following formula into a chart.
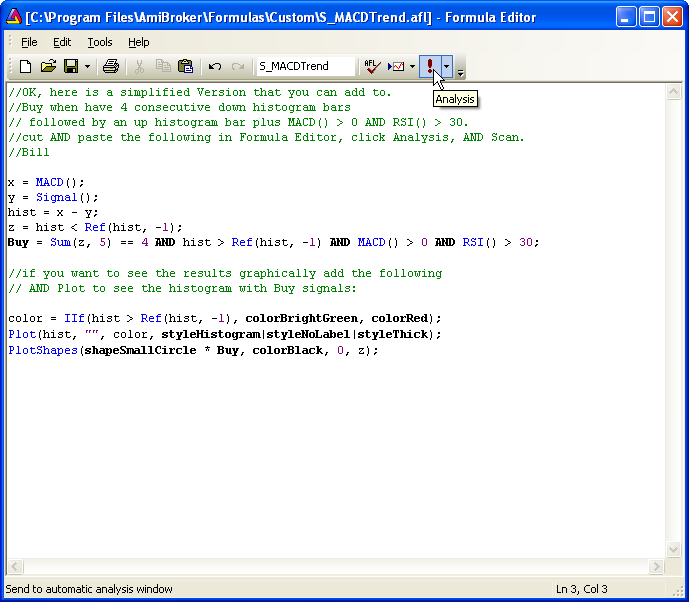
2) Run a Scan in AA using S_MACDTrend with All symbols, n last days, n = 1 and Sync chart on select as the settings.
Stocks that meet the criteria will be reported in the Results list.
Note: Some variations of the setup rules can define signals that are quite rare and in small databases it is possible that there will be no setups on any given day (hence no stock will be reported by the scan).
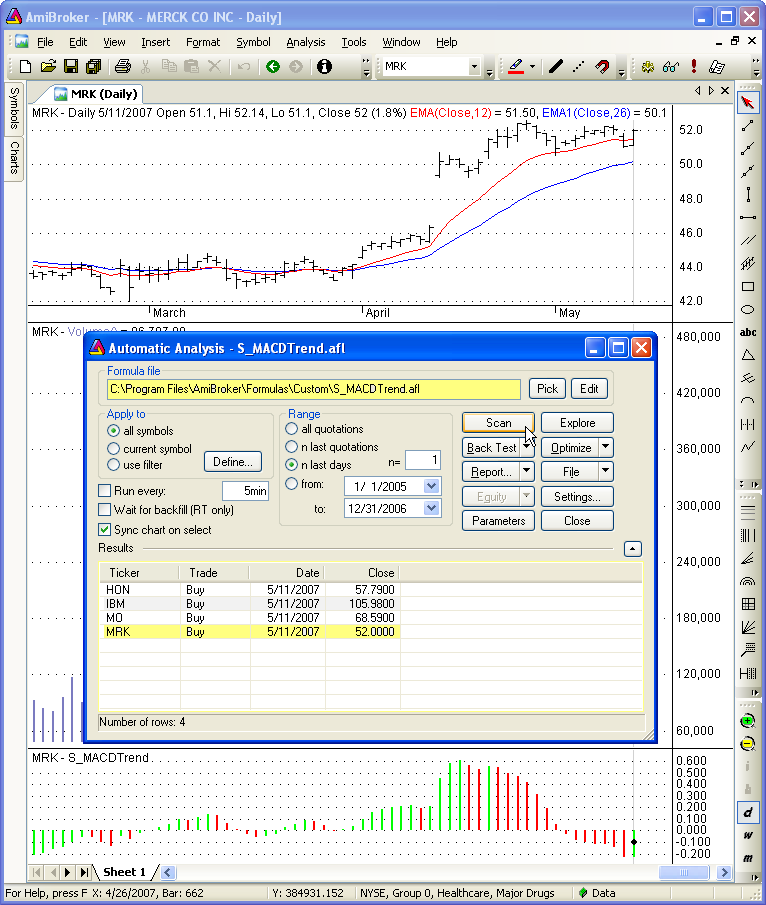
3) Click on any symbol in the Results pane to view the chart, for that symbol, in the background.
Note: In this example a training database, that only contains data up to 5/11/2007, was used.
- Trading idea by protraderinc.
- Comments and formula by Bill – WaveMechanic.
AmiBrokerYahooGroup message #116233 “MACD Histogram” http://finance.groups.yahoo.com/group/amibroker/message/116233
Filed by brian_z at 11:06 pm under Ideas (Experimental)
Comments Off on MACD Trend System
October 14, 2007
15 Day Performers Trading System
Filed by brian_z at 10:43 pm under Ideas (Experimental)
Comments Off on 15 Day Performers Trading System
August 19, 2007
KISS-001: Intraday Gap Trading
This is the first in a series off KISS (keep it simple, stupid) trading ideas for you to play with. All system ideas presented here are unproven, unfinished, and may contain errors. They are intended to show possible patterns for further exploration. As always, you are invited to make comments and/or add your own ideas to this series.
I prefer real-time systems that trade fast, are automated, and are devoid of traditional indicators. Preferably, they should have no optimizable parameters; however, I may not always be able to meet this objective. Not all systems will be ‘that’ simple; there will be some that use simple averaging or HHV/LLV type functions. The first system shown below is a copy of the demo system I use to develop Trade-Automation routines elsewhere on this site.
Real-Time Gap-Trading.
To see how this works, you should Backtest it on 1-minute data with a periodicity in the range of 5-60 minutes. Your first impression may be that these profits are simply due to an up market, however, the fact that Long and Short profits are about equal suggests there is more to it. Because 98% of all trades fall between 9:30 AM and 10:30 AM, this type of system is nice if you just want to trade a short time each day. This reduces risk with respect to market exposure and gives you more time to enjoy other activities.
SetOption("CommissionMode",3);
SetOption("CommissionAmount", 0.005);
SetTradeDelays(0,0,0,0);
Buy = O < Ref(L,-1);
BuyPrice = O;
Sell = L < Ref(L,-1);
SellPrice = C;
Short = O > Ref(H,-1);
ShortPrice = O;
Cover = H > Ref(H,-1);
CoverPrice = C;
E=Equity(1);
Plot(C,"",1,128);
if( PlotTriangles = ParamToggle("Triangles","HIDE|SHOW",1) )
{
PlotShapes(IIf(Buy, shapeSmallUpTriangle, shapeNone),5,0,BuyPrice,0);
PlotShapes(IIf(Sell, shapeHollowDownTriangle, shapeNone),4,0,SellPrice,0);
PlotShapes(IIf(Cover, shapeHollowUpTriangle, shapeNone),5,0,CoverPrice,0);
PlotShapes(IIf(Short, shapeSmallDownTriangle, shapeNone),4,0,ShortPrice,0);
}
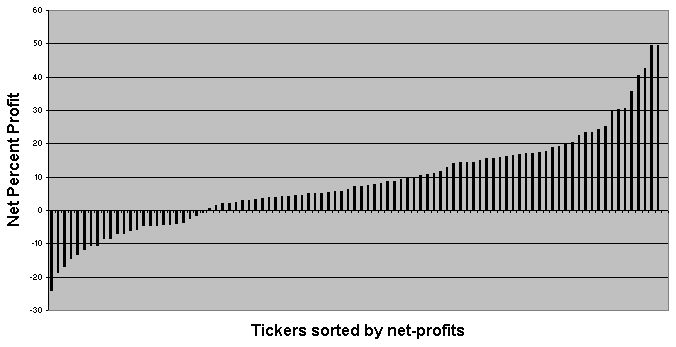
Backtesting this on the NASDAQ-100 watchlist (individual backtests, 15 min. Periodicity) gives the profits shown below for the period of 1 MAR 2007 to 17 AUG 2007. Ticker names are omitted to keep the chart compact; the chart simply shows a net profit bar for each ticker tested. Average exposure for this system is about 15%; hence, you may be able to trade portfolios to increase profits and smooth the equity curves. Be cautioned that in its raw form the drawdowns are unacceptable and that there may be volume restrictions for many tickers.
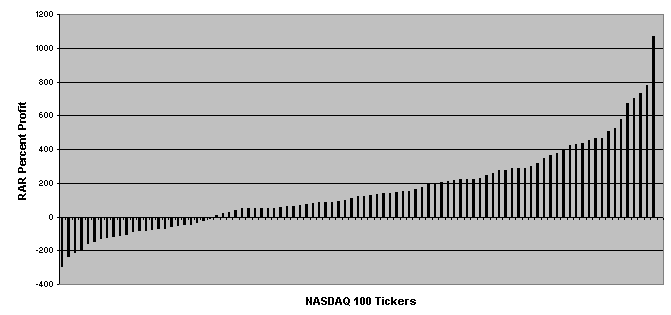
Since this system has low exposure, it may be a candidate for market scanning and ranked portfolio trading. RARs would be an indication of the absolute maximum profits that could be obtained if one succeeded to increase exposure to near 100%. However, price movement from different tickers may be correlated, and trades from different tickers may overlap. If many tickers trade at the same time, it would be difficult to increase system exposure.
Edited by Al Venosa.
Filed by Herman at 1:49 pm under Ideas (Experimental)
Comments Off on KISS-001: Intraday Gap Trading
July 16, 2007
Introduction to Trading Systems – Ideas
This is where you can share trading systems that are marginally profitable, i.e., those that should not be traded as they are but that show potential. Typically this would be a basic system that is profitable but experiences draw downs of 50%. Such systems can often be improved by adding Stops, Targets, Money Management, Portfolio techniques, etc. The reality is that while you may not have the expertise to make it work someone else may.
Almost all of us find trading system ideas in books and magazines that we then code in AFL for evaluation. Some of these systems may have been around for many years while others are new ideas. After coding them, almost always, we are disappointed and chuck out the system (work!). Instead of throwing out your work you are invited to post the system here to give another developer a chance to fix it.
You are invited to contribute as an author (requires registration) or in a comment to this post.
Filed by Herman at 11:04 am under Ideas (Experimental)
Comments Off on Introduction to Trading Systems – Ideas