August 25, 2011
Bollinger Band ZigZag Indicator
IMPORTANT: Do not use the indicator in a real trading system; it looks ahead in time and will make you lose money. It is meant for research only: to show potential profits and display arrows at highly profitable positions to facilitate formulating better trading rules.
The indicator presented here is very similar to the ZigZag Indicator except that the turning points for this indicator are where the opposite Bollinger Bands are last breached before the next signal.
The formula is written as a trading system. It can be Backtested, and the BB period and width can be optimized. Since this is just an experimental formula no attempt has been made to optimize the code.

function ParamOptimize( description, defaultVal, minv, maxv, step )
    {
    return Optimize(description, Param(description,defaultVal, minv, maxv, step ), minv, maxv, step );
    }

BlankBars = 10; // Set to the number set in preferences

Buy = Sell = Short = Cover = Pos = 0;
Periods = ParamOptimize( "Periods", 3, 3, 30, 1 );
Width = ParamOptimize( "Width", 1, 0, 5, 0.1 );
BBTOp = BBandTop( H, Periods, Width ); // Note H is used instead of the tradional C
BBBot = BBandBot( L, Periods, Width ); // Note L is used instead of the tradional C

Plot( BBTop, "BBTop", colorBlue, styleLine );
Plot( BBBOt, "BBBot", colorBlue, styleLine );
Plot( C, "", 1, 128 );

BI = BarIndex();
start = Status( "firstvisiblebarindex" ) - BI[0] - BlankBars;
end     = Status( "lastvisiblebarindex" ) - BI[0] - BlankBars;
LBI = LastValue( BarIndex() );

for ( b = LBI; b > Periods; b-- )
{
    if ( L[b] <= BBBot[b] AND pos <= 0 )
    {
        pos = 1;
        Buy[b] = True;
        BuyPrice[b] = BBBot[b];
    }
    else
        if ( H[b] >= BBTop[b] AND Pos >= 0 )
        {
            Pos = -1;
            Sell[b] = True;
            SellPrice[b] = BBTop[b];
        }
}

Short = Sell;
ShortPrice = SellPrice;

Cover = Buy;
CoverPrice = BuyPrice;

Eq = Equity( 1 );

if ( ParamToggle( "Equity", "HIDE|SHOW", 0 ) )
    Plot( Eq, "", colorYellow, 1 | styleOwnScale );

ShowTriangles = ParamToggle( "Arrows", "HIDE|SHOW", 1 );

if ( showTriangles )
{
    PlotShapes( IIf( Buy,     shapeSmallUpTriangle, shapeNone ), 5, 0, BuyPrice, 0 );
    PlotShapes( IIf( Sell,    shapeHollowDownTriangle, shapeNone ), 4, 0, SellPrice, 0 );
    PlotShapes( IIf( Cover, shapeHollowUpTriangle, shapeNone ), 5, 0, CoverPrice, 0 );
    PlotShapes( IIf( Short, shapeSmallDownTriangle, shapeNone ), 4, 0, ShortPrice, 0 );
}

if ( ParamToggle( "Trade Lines", "HIDE|SHOW", 0 ) )
{
    Sig = Buy OR Short;
    signum = Cum( Sig );
    y0 = 0;
    y1 = C[0];
    TPrice = C;
    Shortcolor = LongColor = colorWhite;

    for ( b = start ;b < end ;b++ )
    {
        if ( Sig[b] )
        {
            x0 = y0;
            x1 = y1;
            y0 = b;

            if ( Buy[b] )
            {
                y1 = BuyPrice[b];
                Color = Shortcolor;
            }
            else
                if ( Short[b] )
                {
                    y1 = ShortPrice[b];
                    Color = Longcolor;
                }

            if( SigNum[b] > 1 ) Plot( LineArray( x0, x1, y0, y1 ), "", Color, 1 | styleThick );
        }
    }
}
 Filed by Herman at 8:43 pm under Indicators
Comments Off on Bollinger Band ZigZag Indicator
January 6, 2011
Reducing Indicator-Lag
The usual way to reduce Indicator lag in averaging formulas, such as the MA(), EMA, and Tilson T3(), is to try and dream up a completely new formula. This isn’t easy. It is often easier to remove lag from an already smoothed plot, than to improve the basic smoothing formula.
Indicator Delay is often an essential Indicator quality and (imo) is not the same as Indicator Lag. The ideal smoothing function is one with zero delay, i.e., one that tracks the price with a perfectly smooth-looking plot. Delay can be added later as an independent quality using the ref() function. Some smoothing formulas already have a sensitivity adjustment, these will not necessarily behave in the same manner as the LagReducing factor used below. Optimizing all parameters for best results is recommended.
The Lag-Reducing formula presented here can be applied to most averaging formulas and to indicators that are based on averages (like Bands). The lag reducing parameter (RLFactor) of the Reducelag() function can also be used to make formulas adaptive with respect to another price or Indicator quality. The image below shows how lag has been reduced for the Tilson T3 formula.

To see how this formula works Apply the code show below to a new indicator pane, open the Parameter window, and try different settings.
function T3( Price, T3Periods, s )
{
    e1    = AMA( Price, 2 / ( T3Periods + 1 ) );
    e2    = AMA( e1, 2 / ( T3Periods + 1 ) );
    e3    = AMA( e2, 2 / ( T3Periods + 1 ) );
    e4    = AMA( e3, 2 / ( T3Periods + 1 ) );
    e5    = AMA( e4, 2 / ( T3Periods + 1 ) );
    e6    = AMA( e5, 2 / ( T3Periods + 1 ) );
    C1 = -s ^ 3;
    C2 = 3 * s ^ 2 * ( 1 + s );
    C3 = -3 * s * ( s + 1 ) ^ 2;
    C4 = ( 1 + s ) ^ 3;
    T3Result = c1 * e6 + c2 * e5 + c3 * e4 + c4 * e3;
    return Nz( T3Result );
}

function ReduceLag( Indicator, RLFactor )
{
    return ( Indicator / Ref( Indicator, -1 ) ) ^ RLFactor*Indicator;
}

_SECTION_BEGIN( "REDUCING INDICATOR LAG" );
LRFactor         = Param( "Lag-Reducing Factor", 1.7, 0, 10, 0.1 );
Periods         = Param( "T3 Periods", 5, 1, 10, 1 );
Sensitivity        = Param( "T3 Sensitivity 1", 0.7, 0, 3, 0.03 );

I1 = T3( O, Periods, Sensitivity );
I2 = Reducelag( I1, LRFactor );

Plot( C, "Close", 1, 128 );
Plot( I1, "\nBasic T3", 2, 1 );
Plot( I2, "\nLag-Reduced T3", 4, 1 | styleNoRescale );
_SECTION_END();
Filed by Herman at 9:32 am under Indicators
Comments Off on Reducing Indicator-Lag
October 19, 2007
MACD Histograms (v1)
Filed by brian_z at 4:52 am under Indicators
Comments Off on MACD Histograms (v1)
September 30, 2007
Plotting Gap Prices
This indicator program was developed for the trader who wishes to plot opening gaps to aid his identification of where gaps occur in a price chart. The gaps are drawn as horizontal lines (green upper, red lower) extending a variable number of bars to the right of the gap.
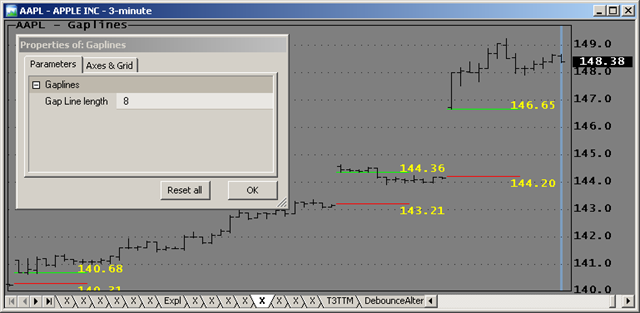
The code hasn’t been optimized so that you can use the variables in subsequent code. While AFL has GapUp() and GapDown() functions the code below uses custom definitions to allow substitution of other criteria.
Filed by Herman at 12:49 pm under Indicators
Comments Off on Plotting Gap Prices