August 18, 2007
Gap-Trading demo, Session Timing Example
This post shows how to add intraday session timing to the Real-Time Gap-Trading (RTGT) system developed in the previous post. However, before tackling session timing, there are a few things you should be aware about:
Time-Synchronization
In real-time trading there are many functions that are timed with reference to your system’s clock. It is therefore imperative that you always synchronize your computer clock with an Internet timeserver before each trading session.
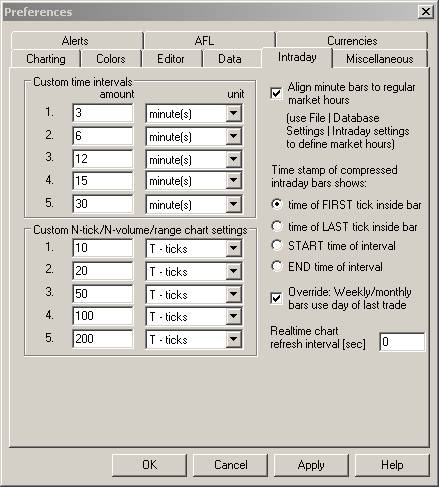
Tools -> Preferences -> Intraday settings
Data Timestamps can be aligned to either the start or the end of the base period. The code developed here uses time of FIRST tick inside bar, i.e., the data timestamp returns the time at the start of the bar. This is when the first quote for the new period arrives and defines the Open for the new bar. Click Tools -> Preferences -> Intraday to set this option:
Backtesting and Bar-Replay
During backtesting the timing resolution will be equal to the periodicity set in AA Settings. If you are comparing Backtester signals with the signals displayed on your chart, you must make sure that the AA and Chart use the same periodicity.
During Bar Replay the timing resolution will be equal to the greater of the base interval of your database or the Step Interval selected in the Bar-Replay window.
During Backtesting and Bar-Replay, AmiBroker will refer to the timestamp to know how prices change over time. Hence, you will have no choice but to time events, such as session timing, with reference to the data timestamp.
Live Trading
When trading from an Indicator, the data timestamp is rounded to the selected chart-periodicity, i.e., if you display a 1-minute chart, the timing resolution will be one minute. This means you cannot implement delays based in seconds using the data timestamps of a minute database. This is why most functions in a real-time trading system use the computer clock as reference.
You can, with caution, use either the data timestamp or the system’s clock to control your session. However, since the data timestamp is dependent on the arrival of new quotes (ignoring data padding), using data timestamp could be unreliable. If you want higher timing resolution, you could create a 5-second database. However, this means working with slow backfills and slow AFL executions, due to lengthy data histories. To keep things simple, we will use a one-minute database.
Session Timing
When you are developing real-time trading systems, it is often handy, even essential sometimes, to develop several code versions. Typically, these might include:
1) A version for Backtesting and Bar-Reply. This version would use the TimeNum function for timing.
2) A Real-Time trading version. This version would use the system clock (Now()) for timing and would be highly optimized for AFL execution speed.
3) A DebugView version. This is a useful intermediate development stage that lets you run your system in real-time without any TWS interfacing; it logs trades to DebugView instead of sending them to the TWS.
ParamTime() input statements are used to set the start- and end-time of the trading session. The code below is only intended for preliminary system evaluation using the Backtester: hence, is uses time-numbers for session timing.
The StartOfSession and EndOfSession variables are triggers (they last only one bar). They are used to initialize processes at the start of the session and clean up processes at the end of the session. The InSessionTime variable is True during trading and is used to control processes that must be turned On/Off depending on whether you are trading or not. These processes will be covered in future posts.
A TimeFrame Parameter has been added to help visualize how the system works in different timeframes. To see the equity for different timeframes, just drag the slider to see the system response to any timeframe from 1 minute to 1 hour. Having added Session Timing you can now explore whether this system is more profitable during certain hours of the trading day. I suggest you perform an individual backtest on you favorite watchlist; you may be surprised to find that with some systems there is no need to trade all day. More…
For debugging purposes, you can turn On/Off a colored ribbon to display the Start- (Green), End- (Red) and In-Session (Yellow) variables.
For convenience the code below includes all previously developed parts. Just copy to an Indicator formula window, and click Apply.
<p>_SECTION_BEGIN("SESSION TIMING"); <p>TimeFrame= Param("Chart Timeframe (min)",1,1,60,1)*60; <p>TimeFrameSet(TimeFrame); <p>TN = TimeNum(); <p>ParamStartTime = ParamTime("Session Start","09:30:00"); <p>ParamEndTime = ParamTime("Session End","15:59:00"); <p>InSessionTime = TN >= ParamStartTime AND TN <= ParamEndTime; <p>StartOfSession = InSessionTime > Ref(InSessionTime,-1); <p>EndOfSession = InSessionTime < Ref(InSessionTime,-1); <p>InsessionTime = InSessionTime OR EndOfSession; <p>_SECTION_END(); <p>Buy = O < Ref(L,-1) AND InsessionTime; <p>BuyPrice = O; <p>Sell = L < Ref(L,-1) OR EndOfSession; <p>SellPrice = C; <p>Short = O > Ref(H,-1) AND InsessionTime; <p>ShortPrice = O; <p>Cover = H > Ref(H,-1) OR EndOfSession; <p>CoverPrice = C; <p>SetTradeDelays(0,0,0,0); <p>SetOption("CommissionMode",3); <p>SetOption("CommissionAmount", 0.005); <p>E=Equity(1); <p>TradeEquity = ValueWhen(Sell OR Cover,E); <p>_SECTION_BEGIN("PLOTTING"); <p>Plot(C,"",1,128); <p>if( ParamToggle("Session Timing Ribbons","HIDE|SHOW",0) ) <p>{ <p>Plot( InSessionTime,"",7,styleArea|styleOwnScale|styleNoLabel,0,60); <p>Plot( StartOfSession,"",5,styleArea|styleOwnScale|styleNoLabel,0,30); <p>Plot( EndOfSession,"",4,styleArea|styleOwnScale|styleNoLabel,0,30); <p>} <p>OutOfSessionColor = ParamColor("Out of Session",colorDarkRed); <p>Plot(NOT InSessionTime,"",OutOfSessionColor,styleArea|styleOwnScale|styleNoLabel,0,1); <p>PlotShapes(IIf(Buy, shapeSmallUpTriangle, shapeNone),5,0,BuyPrice,0); <p>PlotShapes(IIf(Sell, shapeHollowDownTriangle, shapeNone),4,0,SellPrice,0); <p>PlotShapes(IIf(Cover, shapeHollowUpTriangle, shapeNone),5,0,CoverPrice,0); <p>PlotShapes(IIf(Short, shapeSmallDownTriangle, shapeNone),4,0,ShortPrice,0); <p>if(ParamToggle("Equity curve","HIDE|SHOW",0) ) <p>{ <p>Plot(TradeEquity,"",2,styleStaircase|styleOwnScale); <p>}
 Filed by Herman at 2:07 pm under Real-Time System Design
Comments Off on Gap-Trading demo, Session Timing Example