Numbering Bars

When you are developing systems and discussing charts with other traders by email, it is often convenient to be able to refer to the bars on your chart by number, date, or time. The code below can be appended to the end of your code to give you these options:

The b < Barcount check prevents out of range errors when you have AmiBroker Preferences set to give you a number of Blank bars at the right edge of your chart.

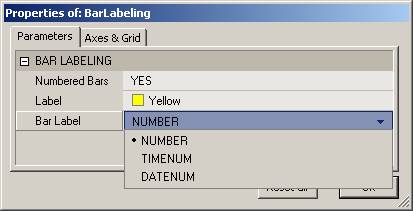
Plot(C,"",1,128); 
_SECTION_BEGIN("BAR LABELING"); 
ShowBars ParamToggle("Label Bars","NO|YES",0);
LabelCo ParamColor("Label",colorYellow);
Label ParamList("Bar Label","NUMBER|TIMENUM|DATENUM",0); 
GraphXSpace 10; 
if( Showbars ) 
{ 
DN=DateNum(); 
TN=TimeNum(); 
FirstVisibleBar Status"FirstVisibleBar" ); 
Lastvisiblebar Status("LastVisibleBar");  
for( FirstvisiblebarBN=0<= Lastvisiblebar AND BarCountb++) 
{ 
if( Label == "NUMBER" BarLabel NumToStr(BN++,1.0); 
else if ( Label == "TIMENUM" BarLabel NumToStr(TN[b],1.0); 
else BarLabelNumToStr(DN[b],1.0); 
PlotText("\n^\n"+BarLabel,b,L[b],LabelCo); 
} 
} 
_SECTION_END();


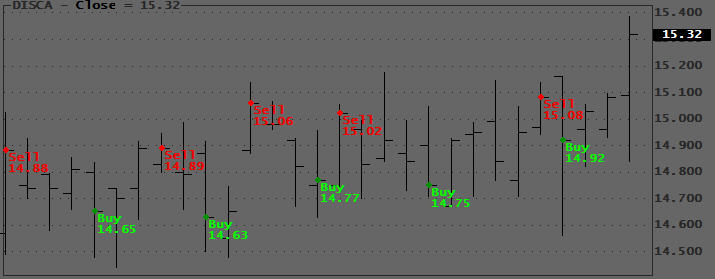
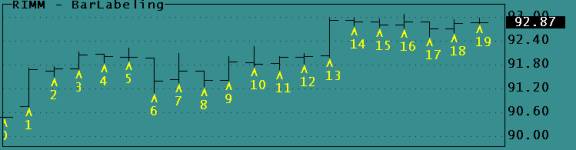
The labeled charts look like this:

Below a more streamlined version using the Switch():

_SECTION_BEGIN"BAR LABELING" );
PlotC""1128 );
ShowBars ParamToggle"Label Bars""NO|YES");
LabelCo ParamColor"Label"colorYellow );
Label ParamList"BarLabel""NUMBER|TimeNum|DateNum|BARNUM|WEEKDAYNUM|WEEKDAY");
GraphXSpace 10;

if ( Showbars )
{
    DN DateNum();
    TN TimeNum();
    WD DayOfWeek();
    WDList "SUN,MON,TUE,WED,THU,FRI,SAT";
    FirstVisibleBar Status"FirstVisibleBar" );
    Lastvisiblebar Status"LastVisibleBar" );

    for ( FirstvisiblebarBN 0<= Lastvisiblebar AND BarCountb++ )
    {
        switch ( Label )
        {
            case "NUMBER":
                BarLabel NumToStrBN++, 1.0 );
                break;
            case "TIMENUM":
                BarLabel NumToStrTN[b], 1.0 );
                break;
            case "BARNUM":
                BarLabel NumToStrb1.0 );
                break;
            case "WEEKDAYNUM":
                BarLabel NumToStrWD[b], 1.0 );
                break;
            case "WEEKDAY":
                BarLabel StrExtractWDListWD[b] );
                break;
            default:
                BarLabel NumToStrDN[b], 1.0 );
                break;
        }
        PlotText"\n^\n" BarLabelbL[b] - ( H[b] - L[b] ), LabelCo );
    }
}
_SECTION_END();

Edited by Al Venosa.

Order Simulation using DebugView

The design of real-time automated trading systems involves two major design phases: 1) Designing the trading system and 2) Developing the trade-automation code. While you may be able to re-use some previously developed AT functions, you can rarely transport the entire automation section from one trading system to the next. Adjusting your AT code to work with a new system can be very time consuming; it can involve weeks of real-time testing and debugging. Using the code below you can test your new system ideas, in a tick environment, before you have written a single line of automation code.

Note that when testing this code with the Bar-Replay tool, the log will display the bar’s closing price instead of the Lastprice (tick data). When testing this code with your own trading system, you may want to add extra output to the _TRACE() statements. The code below substitutes DebugView output for orders that would have normally gone to the TWS:

dbvlog.jpg

DebugView vs. Interpretation Window

As pointed out in a comment to this series, the Interpretation Window can be a valid alternative to using DebugView. A few points to consider when choosing either method are listed below.

DebugView

Debug information is routed to DebugView using this type of statement:

<p>DBVOn ParamToggle("DebugView","OFF|ON",0); // Controls all output  <p>if( DBVOn ) _TRACE("# BuyPrice ="+NumToStr(BuyPrice,1.2));  

Any type of information that can be expressed in string format can be send to DebugView. A few DebugView features are:

– A stand-alone program
– Display accumulates multi-pass information
– Output includes timing information
– Output can be manually or auto saved to a file
– Optional scrolling display
– Copy and paste to/from clipboard
– History depth setting (#lines displayed)
– Filter/Highlight wrt keywords
– Always on top
– Find
– Software Clear display
– Low overhead (depending on the number of _TRACE() statements used)

Interpretation Window

Debug information is routed to the Interpretation Window using this type of statement:

<p>BuyPrice LastValue(C);  <p>if(Status("Action") == actionCommentary)  
<p>{  
<p>// This code executes only when the Interpretation Window is open.  
<p>printf("Buy=%1.2f\n"BuyPrice);  
<p>}  

Some features offered by the Interpretation Window:

– The Interpretation Window is optimized for Chart-Commentaries
– Only displays info for current pass
– No history
– Copy and paste to clipboard
– An open Interpretation Window adds one full execution cycle to the code.

While not all pros and cons were covered it can be seen from the above listing that DebugView is designed for debugging while the Interpretation Window is not.

When running complex real-time trading systems the additional pass through the AFL code may prove to be too costly in terms of execution speed.

Further comments invited.

Adding Manual Test Signals

Introduction to Debugging AFL

Designing Automated-Trading systems can be complicated, and you can expect to spend a significant amount of time debugging your code. You will undoubtedly experience elusive problems that may be due to Internet delays, faulty data (such as low volume data spikes), orders that do not get processed, lack of volume, communication problems, etc. Such problems require you to know how to capture and display transient conditions, such as, for example, how orders are processed and acknowledged.

In real-time trading many events are not completed in a single AFL execution but in a sequence of small steps that are spread out over time and over many chart refreshes (AFL executions). This requires debugging techniques that are very different from EOD programming.

This category covers basic debugging techniques, such as: how to capture transient events, maintain a log, zero in on run-time bugs, display system variables, etc. Developing basic debugging techniques up front will save you significant time later.

Edited by Al venosa

Detecting Look-Ahead Problems

Look-ahead problems occur when, during Backtesting, your code uses future prices to calculate signals. When this happens, your system’s performance may be heavily inflated, but obviously since you are looking into the future, the system cannot be traded.

While the Indicator formula editor menu has a Check function, it often fails when debugging complex systems, especially if they use Plug-Ins or DLLs. Also, when it discovers a problem, it does not show you at which bar the problem occurred. The simple code presented here detects all look-ahead problems that might occur during a Backtest, even if your system uses Plugins or DLLs, and it can be appended to any system.

The code makes use of the fact that setting a future bar to NULL will cause dependent variables and signals to change. To use this technique your Arrows must be placed using the PlotShapes() function so that they will change when you NULL future bars. This would not happen if the arrows are placed by the Backtester. Thus, you should turn Off Arrows in your Param() menu.

To test for Look-Ahead problems, you should copy the code to your system formula and Apply it to an Indicator pane. Make sure your chart is fully right justified so that you can see the last bar, and zoom so that you can see some signal arrows. Next, open the Param window and move the slider to change the Remove Bars count. As you do this you will see bars disappearing, last bar first. When the disappearance of a bar causes a preceding arrow to disappear, your system looks ahead.

Note that this code can also be used to detect Indicator dependence on future bars. If your indicator changes ahead of your NULL bar, your Indicator is dependent on future data. When changes are very small, this may be hard to see. It would be an interesting coding challenge to save a number of bars and compare so that even small changes can be detected. Perhaps someone will write a DLL to do all this for us.

A minor drawback of this code is that you have to scan your chart manually, which may take a few minutes. You could add an automated scan and run the code using an exploration, generating an error table for an entire Watchlist. It wouldn’t be very fast, but it would increase the chance of detecting all possible errors.

The demo code below uses the Zig() function to place signals and arrows on the chart. Since Zig() looks ahead by varying amounts, it is perfect to demonstrate how this code works.

EnableNulling = ParamToggle("NULLing of Data","DISABLED|ENABLED",0);
RM = Param("NULL Bars L<-R",0,0,1000,1);
if( EnableNulling )
{
Z = Null;
LB = LastValue(BarIndex());
O = IIf(BarIndex()>(LB-RM),Z,O);
H = IIf(BarIndex()>(LB-RM),Z,H);
L = IIf(BarIndex()>(LB-RM),Z,L);
C = IIf(BarIndex()>(LB-RM),Z,C);
}
ZChange = Param("%Zig",0.1,0,1,0.05);
Z = Zig(C,ZChange);
Buy = Z < Ref(Z,1) AND Z < Ref(Z,-1);
Sell = Z > Ref(Z,1) AND Z > Ref(Z,-1);
Short = Sell;
Cover = Buy;
Plot(C,"",1,128);
PlotShapes(IIf(Buy, shapeSmallUpTriangle, shapeNone),5,0,BuyPrice,0);
PlotShapes(IIf(Sell, shapeHollowDownTriangle, shapeNone),4,0,SellPrice,0);
PlotShapes(IIf(Cover, shapeHollowUpTriangle, shapeNone),5,0,CoverPrice,0);
PlotShapes(IIf(Short, shapeSmallDownTriangle, shapeNone),4,0,ShortPrice,0);

Edited by Al Venosa

Bar-Scaling Tool

When testing short-term trading systems that respond to single-bar price changes it is very convenient to be able to manually change a bar’s price and force a signal. The small program listed below can be prefixed to your system’s code and will do this by magnifying the selected High, Low and Close price with respect to the Open price of the bar.

SetBarsRequired(100000,10000);
BI=BarIndex();
SB=LastValue(ValueWhen(BI==SelectedValue(BI),BI));
EnableScaling=ParamToggle("Bar Scaling","DISABLED|ENABLED");
ScalingFactor=Param("HLC Scaling Factor",1,0,5,0.01);
if(EnableScaling)
{
Hd=H[sb]-O[sb];
Ld=O[sb]-L[sb];
Cd=C[sb]-O[sb];
Hd=ScalingFactor*Hd;
Ld=ScalingFactor*Ld;
Cd=ScalingFactor*Cd;
H[sb]=O[sb]+Hd;
L[sb]=O[sb]-Ld;
C[sb]=O[sb]+Cd;
}
//Code to demonstrate bar scaling
Short=Cover=0;
Buy=Cross(High,Ref(H,-1));
Sell=Cross(Ref(L,-1),L);
BuyPrice=Ref(H,-1);
SellPrice=Ref(L,-1);
Plot(C,"",1,128);
PlotShapes(IIf(Buy,shapeUpTriangle,shapeNone),colorBrightGreen,0,BuyPrice,0);
PlotShapes(IIf(Sell,shapeDownTriangle,shapeNone),colorRed,0,SellPrice,0);

Edited by Al Venosa

Price Bound Checking

When you start to design your own trading system, you will soon realize the need to custom define the BuyPrice, SellPrice, ShortPrice, and CoverPrice. Similarly, you may want to set your trade delays using the in-code function SetTradeDelays(d,d,d,d). Such hard-coded definitions will override the default trade prices and delays set in the Automatic Analysis (AA) Settings, and this will prevent you from inadvertently using the default settings. The problem is that defining your own price arrays increases the risk of introducing pricing errors, such as Price Bound Errors.

AmiBroker provides a function called SetOption(“PriceBoundChecking”,TRUE/FALSE) to Enable/Disable Price Bound Checking. Enabling this option will adjust prices so that they fall within the High-Low range and mask your pricing errors. The problem, of course, is that in practical trading these prices are impossible to trade, and your Backtests will not reflect realistic conditions. The best way to handle this is to turn Off Price Bound Checking and write your own error detection code. The code below checks your trade prices for Out of Bounds errors, displays the number of errors it finds, and plots a red marker (bar) at the bottom of your chart where the error occurs.

SetOption("PriceBoundChecking",False);
BuyError = ( BuyPrice > H OR BuyPrice < L ) AND Buy;
SellError = ( SellPrice > H OR SellPrice < L ) AND Sell;
ShortError = ( ShortPrice > H OR ShortPrice < L ) AND Short;
CoverError = ( CoverPrice > H OR CoverPrice < L ) AND Cover;
PricingErrors = BuyError OR SellError OR ShortError OR CoverError;
Plot(PricingErrors ,"Bound Errors",colorRed,styleArea|styleOwnScale,0,10);
Title = "# Price Bound Errors: "+NumToStr(Cum(PricingErrors),1.0,False)+"\n";

Edited by Al venosa

Plotting Trade-Prices

Instead of the traditional Arrows, which don’t really give you much useful information about your trade (such as filled prices), you can use PlotText() to plot exact Trade Prices, as in the example below:

Plot Price example

//Dummy system to generate some signals (Do NOT trade!)
Short = Cover = 0;
ZC = Zig(C,1);
Buy = T1 = Ref(ZC,1)>ZC;
Sell = T1 = Ref(ZC,1)<ZC;
BuyPrice = ZC;
SellPrice = ZC;
Equity(1);
// plotting prices at the correct level
Plot(C,"Close",colorBlack,styleBar);
PlotShapes( IIf(Buy, shapeSmallCircle, shapeNone),colorBrightGreen, 0, BuyPrice, 0 );
PlotShapes( IIf( Sell, shapeSmallCircle, shapeNone),colorRed, 0 ,SellPrice, 0 );
FirstVisibleBar = Status( "FirstVisibleBar" );
Lastvisiblebar = Status("LastVisibleBar");
for( b = Firstvisiblebar; b <= Lastvisiblebar AND b < BarCount; b++)
{
if( Buy[b] ) PlotText("\n Buy\n "+NumToStr(BuyPrice[b],1.2),b,BuyPrice[b],colorBrightGreen);
else if( Sell[b] ) PlotText("\n Sell\n "+NumToStr(SellPrice[b],1.2),b,SellPrice[b],colorRed);
}

Edited by Al Venosa

DebugView: _TRACE() Statements and Logging

_Trace() Statements

If you use many debug statements, you can speed up your code by using conditional debug code (shown below), and you can control debug output with a ParamToggle() using _TRACE statements:

DBVOn = ParamToggle("DebugView","OFF|ON", 0);
if( DBVOn ) _TRACE( "# "+ YourDebuggingText );

To keep your main code short and simple, you can also wrap the _TRACE() statement into a similarly named custom TRACE() function that you would call instead of the _TRACE() (note the “_” has been removed):

function TRACE( DBVString )
{
global DBVOn;
if( DBVOn ) _TRACE( "# "+ YourDebuggingText );
}

You may find it handy to keep the debugging code in the system until it is fully functional or, if the minor speed penalty is no problem, turn it off and leave it there permanently. You can also create a custom library of debugging functions and make them available for use at any time by including them in your code using a #Include statement, which are stored in the folder C:\Program Files\AmiBroker\Formulas\Include. This path is defined in Tools/Preferences/AFL/Standard Include Path/Formulas/Include.

Logging

Using too many _TRACE() statements or allowing the DebugView output file grow too large will slow down AFL execution. To prevent the file from growing too large, it is a good idea to add a manual clear function so that you can clear it occasionally:

ClearDBV = ParamTrigger("Clear DebugView","CLEAR DBV");
if( ClearDBV ) _TRACE("# DBGVIEWCLEAR");

You can further reduce overhead by controlling the amount of logging detail. You do this by using a ParamList() whereby you can set the required logging level. For example, you might want to control debug statements inside and outside a loop separately. Below is a simple example that scans a Watchlist from your Indicator once every 5-seconds:

RequestTimedRefresh(5);
ClearDBV = ParamTrigger("Clear DebugView","CLEAR DBV");
if( ClearDBV ) _TRACE("# DBGVIEWCLEAR");
DBVLevel = ParamList("DBV Logging Level","NO LOGGING|SCAN TIME ONLY|SCAN TIME AND LOOP",0 );
DBVL1 = DBVLevel == "SCAN TIME ONLY";
DBVL2 = DBVLevel == "SCAN TIME AND LOOP";
scan = Status("redrawaction");
if( Scan )
{
if( DBVL1 OR DBVL2) _TRACE( "#1 Scan Triggered at "+Now(0) );
TickerList = ParamStr("Ticker List","AAPL,BRCM,CSCO,MXIM,GOOG");
for( i = 0; ( Ticker = StrExtract( TickerList, i ) ) != ""; i++ )
{
TickerPrice = GetRTDataForeign("Last",Ticker);
if( DBVL2 )
{
_TRACE( "#2 Scanning "+Ticker+", "+NumToStr(TickerPrice,1.2));
}
}
if( DBVL2 ) _TRACE("#"); // Skip a line in the log
}

Edited by Al Venosa

Next Page »