April 20, 2007
Plotting Trade-Lines
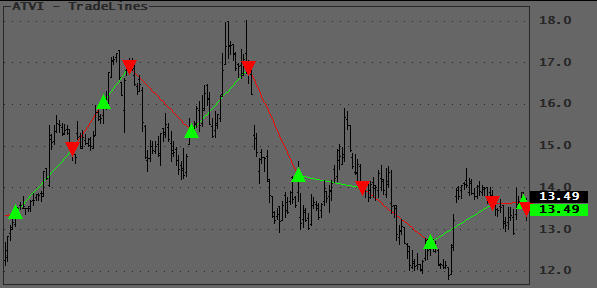
A useful application is to plot straight lines between entry- and exit-signals, giving you the ability to view at a glance the location and magnitude of profits and losses of your trading system. The LineArray() function enables you to draw straight lines from one event or condition to another. In the chart below, which shows a reversal trading system, note how the lines begin and end at the exact trade prices, green being long and red being short. This gives you a quick impression of the profitability and location of individual trades:
Other applications would be plotting of custom ZigZag lines, price channels, trendlines, breakouts, etc.
There are two afl versions listed below, since I believe many of us use the first method, I decided to show them both for educational purposes.
The first one shows how you should NOT plot LineArrays. This method calls Plot() repeatedly and plots each LineArray segment as it is calculated. This is very resource consuming (executes slow) and may trigger a Warning 502 when you display a lot of data. Do not use this version.
The second version shows how Tomasz (Thanks TJ!) combined the individual LineArray segments inside the loop and then plots them with a single Plot() statement outside the loop. This code executes much faster and will never trigger Warning 502. The technique is simple but shows a clever way to combine array segments. Study it :-) it will come in handy one day!
// This version is only listed to show you how it should NOT be programmed
// Dummy system to generate some signals
Buy = Cross( MACD(), Signal() );
BuyPrice = Open;     // Substitute your own prices
Sell = Cross( Signal(), MACD() );
SellPrice = Close;     // Substitute your own prices
PlotShapes( IIf( Buy, shapeSmallUpTriangle, shapeNone ), colorBrightGreen, 0, BuyPrice, 0 );
PlotShapes( IIf( Sell, shapeSmallDownTriangle, shapeNone ), colorRed, 0, SellPrice, 0 );
Plot( C, "", 1, 128 );
// Plot the Trade Lines
Sig = Buy OR Sell;
y0 = 0;
y1 = C[0];
TPrice = C;
FirstVisibleBar = Status( "FirstVisibleBar" );
Lastvisiblebar = Status( "LastVisibleBar" );

for ( b = Firstvisiblebar; b <= Lastvisiblebar AND b < BarCount; b++ )
{
    if ( Buy[b] )
    {
        Co = colorRed;
        TPrice[b] = BuyPrice[b];
    }

    if ( Sell[b] )
    {
        Co = colorBrightGreen;
        TPrice[b] = SellPrice[b];
    }

    if ( Sig[b] )
    {
        x0 = y0;
        x1 = y1;
        y0 = b;
        y1 = TPrice[b];
        Plot( LineArray( x0, x1, y0, y1 ), "", Co, 1 );
    }
}
// Improved version
// Dummy system to generate some signals
Buy = Cross( MACD(), Signal() );
BuyPrice = O; // Substitute your own prices
Sell = Cross( Signal(), MACD() );
SellPrice = C; // Substitute your own prices
PlotShapes( IIf( Buy, shapeUpTriangle, shapeNone ), colorBrightGreen, 0, BuyPrice, 0 );
PlotShapes( IIf( Sell, shapeDownTriangle, shapeNone ), colorRed, 0, SellPrice, 0 );
Plot( C, "", 1, 128 );

// Plot the Trade Lines
Sig = Buy OR Sell;
y0 = 0;
y1 = C[0];
FirstVisibleBar = Status( "FirstVisibleBar" );
Lastvisiblebar = Status( "LastVisibleBar" );
CombinedColor = colorWhite;
CombinedLine = Null;

for ( b = Firstvisiblebar; b <= Lastvisiblebar AND b < BarCount; b++ )
{

    if ( Buy[b] )
    {
        Co = colorRed;
        TPrice[b] = BuyPrice[b];
    }
    else if ( Sell[b] )
    {
        Co = colorBrightGreen;
        TPrice[b] = SellPrice[b];
    }

    if ( Sig[b] )

    {

        x0 = y0;

        x1 = y1;

        y0 = b;

        y1 = TPrice[b];

        La = LineArray( x0, x1, y0, y1 );

        CombinedLine = IIf( IsNull( la ), CombinedLine, la );
        CombinedColor = IIf( IsNull( La ), CombinedColor, Co );
    }
}

Plot( CombinedLine, "", CombinedColor );
Edited by Al Venosa
 Filed by Herman at 9:27 pm under AFL - Utilities and Functions
Comments Off on Plotting Trade-Lines