April 22, 2007
Plotting Trade-Prices
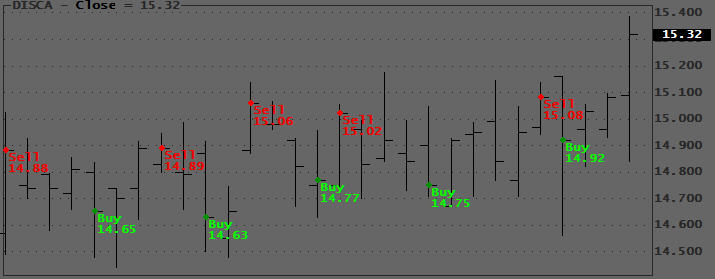
Instead of the traditional Arrows, which don’t really give you much useful information about your trade (such as filled prices), you can use PlotText() to plot exact Trade Prices, as in the example below:
//Dummy system to generate some signals (Do NOT trade!)

Short = Cover = 0;

ZC = Zig(C,1);

Buy = T1 = Ref(ZC,1)>ZC;

Sell = T1 = Ref(ZC,1)<ZC;

BuyPrice = ZC;

SellPrice = ZC;

Equity(1);

// plotting prices at the correct level

Plot(C,"Close",colorBlack,styleBar);

PlotShapes( IIf(Buy, shapeSmallCircle, shapeNone),colorBrightGreen, 0, BuyPrice, 0 );

PlotShapes( IIf( Sell, shapeSmallCircle, shapeNone),colorRed, 0 ,SellPrice, 0 );

FirstVisibleBar = Status( "FirstVisibleBar" );

Lastvisiblebar = Status("LastVisibleBar");

for( b = Firstvisiblebar; b <= Lastvisiblebar AND b < BarCount; b++)

{

if( Buy[b] ) PlotText("\n Buy\n "+NumToStr(BuyPrice[b],1.2),b,BuyPrice[b],colorBrightGreen);

else if( Sell[b] ) PlotText("\n Sell\n "+NumToStr(SellPrice[b],1.2),b,SellPrice[b],colorRed);

}
Edited by Al Venosa
 Filed by Herman at 6:55 pm under Debugging AFL
Comments Off on Plotting Trade-Prices