September 30, 2007
Plotting Gap Prices
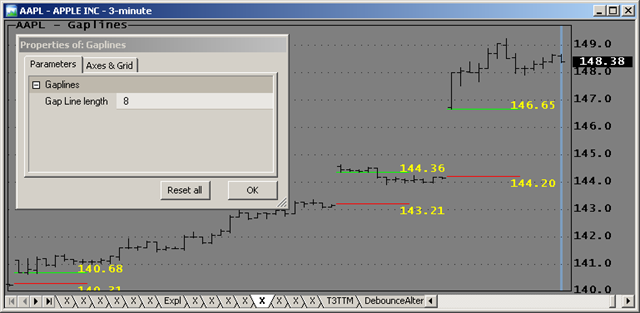
This indicator program was developed for the trader who wishes to plot opening gaps to aid his identification of where gaps occur in a price chart. The gaps are drawn as horizontal lines (green upper, red lower) extending a variable number of bars to the right of the gap.
The code hasn’t been optimized so that you can use the variables in subsequent code. While AFL has GapUp() and GapDown() functions the code below uses custom definitions to allow substitution of other criteria.
 Filed by Herman at 12:49 pm under Indicators
Comments Off on Plotting Gap Prices