August 12, 2007
Designing a Tradable System – Spikes
The phenomenon that is the basis of many trading systems is the observation and trading of an exceptional price movement followed by a pullback.
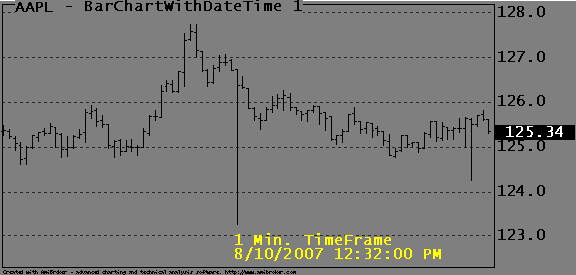
An extreme example of the pullback phenomenon would be a Spike as shown in the chart below. Because the price change is so extreme, the pullback or correction appears instantaneous. There is no clear market response, i.e., traders at large are not inclined to take the price change seriously.

The problem is that inadvertently you can easily write code that trades these spikes. Only when you start trading such a system will you discover that your orders are not filled because the volume just isn’t there. This is a common reason why backtested and real results may sometimes differ substantially. You may have designed a system that is completely rational, backtests perfectly, and stands up to the most detailed technical scrutiny, only to find out that in real trading it fails completely.
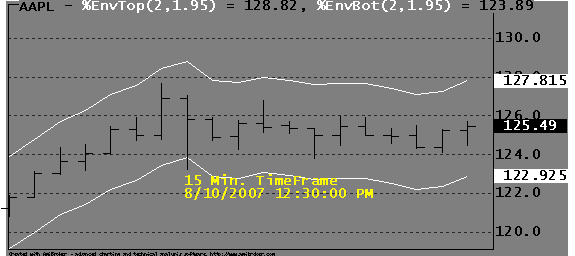
You might think that by increasing the timeframe, for example to 15-minute or even daily, you can minimize this problem. However, while doing this may make the spikes less prominent, the tradability will not improve. Consider the spike in the 15-minute chart below:

Adding a few percent bands makes this look like a real trading opportunity. It looks so easy! However, the Low of the bar is still created by a single trade and the chance to get your order filled would still be minimal. Designing trading systems around minimal-volume price changes is one of the easiest traps for a real-time system developer to fall into. When designing an intraday trading system you should design your code to minimize the divergence of the backtester with respect to real-trading results. You can do this by working in the smallest time frame possible. Even when trading at hourly intervals you should write your code in the minute (or even Tick) timeframe.
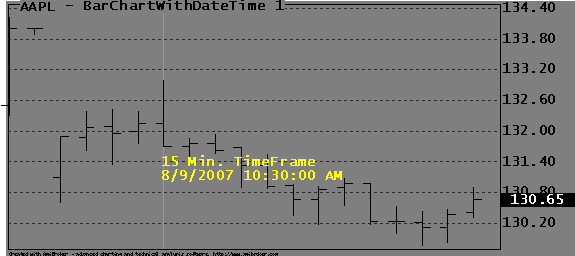
There are a number of ways in which to do this. Take a look at the 10:30 AM spike in the 15-minute chart below and consider how you would determine its tradability:

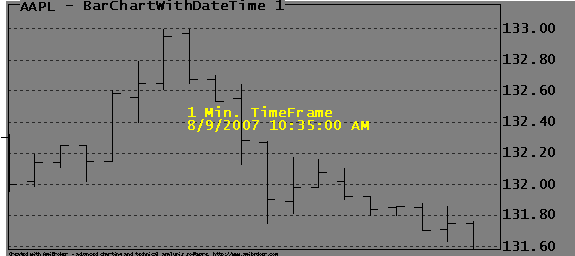
The fact is that there is no way to tell whether the 10:30 AM High is tradable. However, expanding the chart to the 1-minute timeframe, as shown below, lets you clearly see a gradual reversal pattern. This means your order could probably have been filled somewhere near the top of the 15-minute spike shown earlier.

Running your Backtester in the 1-minute timeframe and looking for one-bar confirmations may drop your backtester performance, but your results would have been closer to that which can be obtained in real trading. In this case you would have separate Backtester and Trading code versions for your system; the Backtester code would include signal confirmation while your Trading code would not.
Edited by Al Venosa.
 Filed by Herman at 6:07 pm under Real-Time System Design
Comments Off on Designing a Tradable System – Spikes
