June 19, 2007
Color Formulas
 Filed by brian_z at 5:12 am under Using Custom Colors
Comments Off on Color Formulas
Users' Knowledge Base
ATTENTION: THIS SITE IS OBSOLETE. FOR CURRENT INFORMATION USE www.amibroker.com/kb
|
Filed by brian_z at 5:12 am under Using Custom Colors
Comments Off on Color Formulas
Filed by brian_z at 12:40 am under Using Custom Colors
Comments Off on Extending The Range
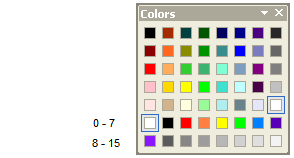
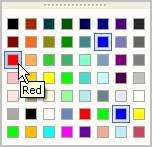
Filed by brian_z at 8:48 am under Using Custom Colors
Comments Off on Palette Editing
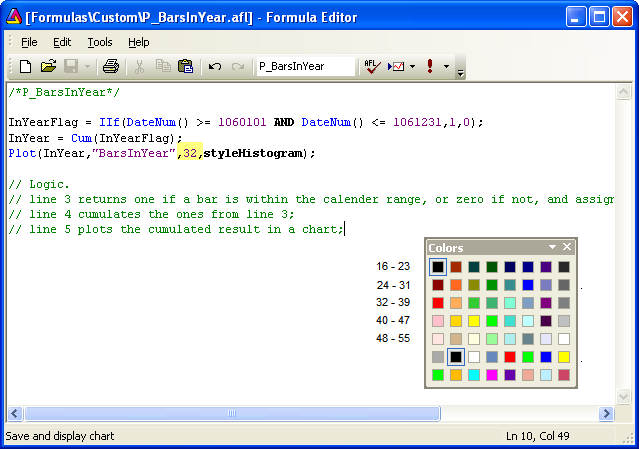
Filed by brian_z at 1:45 pm under Using Custom Colors
Comments Off on Colored Plots
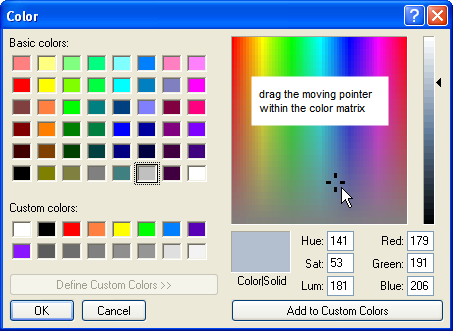
Filed by brian_z at 3:46 am under Using Custom Colors
Comments Off on Color Picking
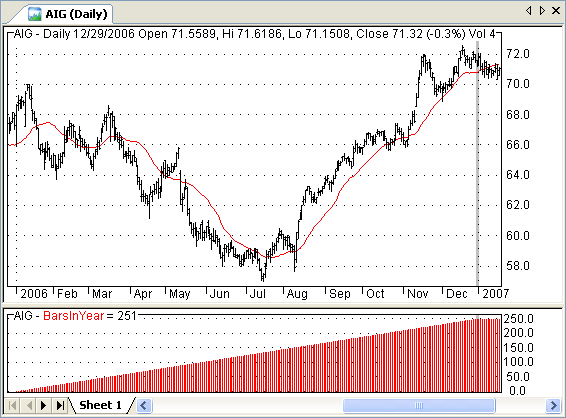
Sometimes it is useful to know the number of trading days in a year e.g. to annualize returns from a system that trades on a daily basis.
On other occasions, index data can contain errors, and the number of daily bars, in a year, can be compared to the exchange calendar, for the relevant index, to check on this failing.
Filed by brian_z at 9:15 am under AFL - The Basics
Comments Off on How Many Trading Days In A Year?
Look-ahead problems occur when, during Backtesting, your code uses future prices to calculate signals. When this happens, your system’s performance may be heavily inflated, but obviously since you are looking into the future, the system cannot be traded.
While the Indicator formula editor menu has a Check function, it often fails when debugging complex systems, especially if they use Plug-Ins or DLLs. Also, when it discovers a problem, it does not show you at which bar the problem occurred. The simple code presented here detects all look-ahead problems that might occur during a Backtest, even if your system uses Plugins or DLLs, and it can be appended to any system.
The code makes use of the fact that setting a future bar to NULL will cause dependent variables and signals to change. To use this technique your Arrows must be placed using the PlotShapes() function so that they will change when you NULL future bars. This would not happen if the arrows are placed by the Backtester. Thus, you should turn Off Arrows in your Param() menu.
To test for Look-Ahead problems, you should copy the code to your system formula and Apply it to an Indicator pane. Make sure your chart is fully right justified so that you can see the last bar, and zoom so that you can see some signal arrows. Next, open the Param window and move the slider to change the Remove Bars count. As you do this you will see bars disappearing, last bar first. When the disappearance of a bar causes a preceding arrow to disappear, your system looks ahead.
Note that this code can also be used to detect Indicator dependence on future bars. If your indicator changes ahead of your NULL bar, your Indicator is dependent on future data. When changes are very small, this may be hard to see. It would be an interesting coding challenge to save a number of bars and compare so that even small changes can be detected. Perhaps someone will write a DLL to do all this for us.
A minor drawback of this code is that you have to scan your chart manually, which may take a few minutes. You could add an automated scan and run the code using an exploration, generating an error table for an entire Watchlist. It wouldn’t be very fast, but it would increase the chance of detecting all possible errors.
The demo code below uses the Zig() function to place signals and arrows on the chart. Since Zig() looks ahead by varying amounts, it is perfect to demonstrate how this code works.
EnableNulling = ParamToggle("NULLing of Data","DISABLED|ENABLED",0);

RM = Param("NULL Bars L<-R",0,0,1000,1);

if( EnableNulling )

{

Z = Null;

LB = LastValue(BarIndex());

O = IIf(BarIndex()>(LB-RM),Z,O);

H = IIf(BarIndex()>(LB-RM),Z,H);

L = IIf(BarIndex()>(LB-RM),Z,L);

C = IIf(BarIndex()>(LB-RM),Z,C);

}

ZChange = Param("%Zig",0.1,0,1,0.05);

Z = Zig(C,ZChange);

Buy = Z < Ref(Z,1) AND Z < Ref(Z,-1);

Sell = Z > Ref(Z,1) AND Z > Ref(Z,-1);

Short = Sell;

Cover = Buy;

Plot(C,"",1,128);

PlotShapes(IIf(Buy, shapeSmallUpTriangle, shapeNone),5,0,BuyPrice,0);

PlotShapes(IIf(Sell, shapeHollowDownTriangle, shapeNone),4,0,SellPrice,0);

PlotShapes(IIf(Cover, shapeHollowUpTriangle, shapeNone),5,0,CoverPrice,0);

PlotShapes(IIf(Short, shapeSmallDownTriangle, shapeNone),4,0,ShortPrice,0);
Edited by Al Venosa
Filed by Herman at 2:53 am under Debugging AFL
Comments Off on Detecting Look-Ahead Problems