April 24, 2007
Analyzing Ticker Relationships
Note: There may be a problem with this code since the possibility of padded data occuring within the correlation period wasn’t considered. This code is under review right now. [Herman]
When experimenting with or looking for trading ideas, you may want to analyze the relationships or correlation between any two tickers. For example, you could be looking for lagging, leading, tracking, or contrarian qualities. You can do this very easily using the Automatic Analysis (AA) Explore function and the AFL Correlation() function.
The example below generates an X-Y table or correlation matrix showing the correlation between tickers selected in the AA Filter (Y-axis) and the tickers from the Watchlist selected in the AA Param window (X-axis). The resulting table looks like this:
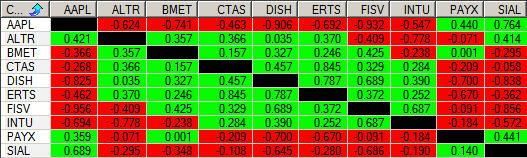
For the X-Y axis to have the same order, you should sort your Watchlist alphabetically in your workspace (right-click on the Watchlist and click Sort Alphabetically). To run the exploration below, copy the code to the AA editor, set the AA Filter for your Watchlist, select your Watchlist in the AA Param window, and click Explore.
WLNum = Param("WatchList Number",0,0,64,1);

CorrPd = Param("Correlation Period",8,1,30,1);

list = GetCategorySymbols( categoryWatchlist, WLNum);

SetOption("NoDefaultColumns",True);

Filter = Status("LastBarInTest");

SetSortColumns( 1 );

AddTextColumn(Name(),"Correlation",1.0);

Ticker1= Name();

for( Col=0; (Ticker2=StrExtract( List, Col))!= ""; Col++)

{

Var2 = Foreign(Ticker2,"C");

Corr = Correlation( C, Var2, CorrPd);

Color = IIf(Corr>0, colorBrightGreen, IIf(Corr<0, colorRed,colorWhite));

Color = IIf(Ticker1==Ticker2, 1, Color);

AddColumn( Corr, Ticker2, 1.3, 1, Color);

}
Edited by Al Venosa
 Filed by Herman at 6:55 pm under Research and System Explorations
Comments Off on Analyzing Ticker Relationships