August 19, 2007
KISS-001: Intraday Gap Trading
This is the first in a series off KISS (keep it simple, stupid) trading ideas for you to play with. All system ideas presented here are unproven, unfinished, and may contain errors. They are intended to show possible patterns for further exploration. As always, you are invited to make comments and/or add your own ideas to this series.
I prefer real-time systems that trade fast, are automated, and are devoid of traditional indicators. Preferably, they should have no optimizable parameters; however, I may not always be able to meet this objective. Not all systems will be ‘that’ simple; there will be some that use simple averaging or HHV/LLV type functions. The first system shown below is a copy of the demo system I use to develop Trade-Automation routines elsewhere on this site.
Real-Time Gap-Trading.
To see how this works, you should Backtest it on 1-minute data with a periodicity in the range of 5-60 minutes. Your first impression may be that these profits are simply due to an up market, however, the fact that Long and Short profits are about equal suggests there is more to it. Because 98% of all trades fall between 9:30 AM and 10:30 AM, this type of system is nice if you just want to trade a short time each day. This reduces risk with respect to market exposure and gives you more time to enjoy other activities.
SetOption("CommissionMode",3);
SetOption("CommissionAmount", 0.005);
SetTradeDelays(0,0,0,0);
Buy = O < Ref(L,-1);
BuyPrice = O;
Sell = L < Ref(L,-1);
SellPrice = C;
Short = O > Ref(H,-1);
ShortPrice = O;
Cover = H > Ref(H,-1);
CoverPrice = C;
E=Equity(1);
Plot(C,"",1,128);
if( PlotTriangles = ParamToggle("Triangles","HIDE|SHOW",1) )
{
PlotShapes(IIf(Buy, shapeSmallUpTriangle, shapeNone),5,0,BuyPrice,0);
PlotShapes(IIf(Sell, shapeHollowDownTriangle, shapeNone),4,0,SellPrice,0);
PlotShapes(IIf(Cover, shapeHollowUpTriangle, shapeNone),5,0,CoverPrice,0);
PlotShapes(IIf(Short, shapeSmallDownTriangle, shapeNone),4,0,ShortPrice,0);
}
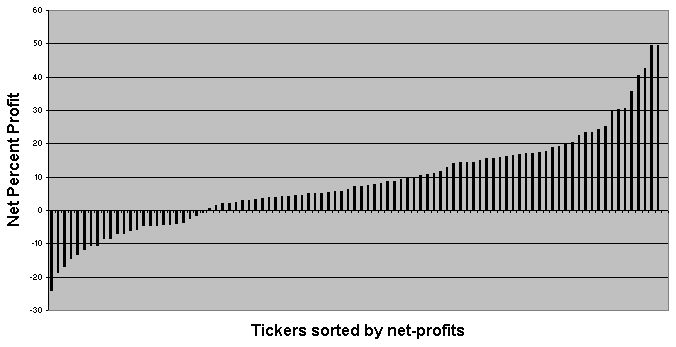
Backtesting this on the NASDAQ-100 watchlist (individual backtests, 15 min. Periodicity) gives the profits shown below for the period of 1 MAR 2007 to 17 AUG 2007. Ticker names are omitted to keep the chart compact; the chart simply shows a net profit bar for each ticker tested. Average exposure for this system is about 15%; hence, you may be able to trade portfolios to increase profits and smooth the equity curves. Be cautioned that in its raw form the drawdowns are unacceptable and that there may be volume restrictions for many tickers.
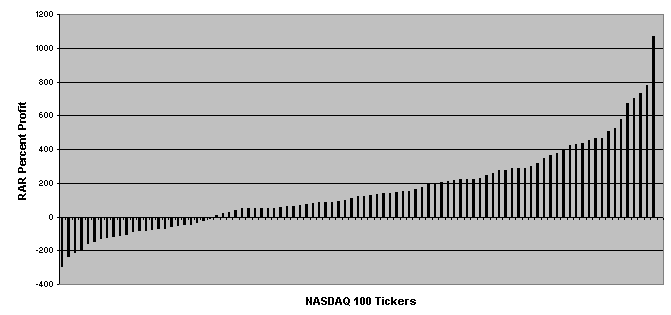
Since this system has low exposure, it may be a candidate for market scanning and ranked portfolio trading. RARs would be an indication of the absolute maximum profits that could be obtained if one succeeded to increase exposure to near 100%. However, price movement from different tickers may be correlated, and trades from different tickers may overlap. If many tickers trade at the same time, it would be difficult to increase system exposure.
Edited by Al Venosa.
 Filed by Herman at 1:49 pm under Ideas (Experimental)
Comments Off on KISS-001: Intraday Gap Trading