Plotting Gap Prices

This indicator program was developed for the trader who wishes to plot opening gaps to aid his identification of where gaps occur in a price chart. The gaps are drawn as horizontal lines (green upper, red lower) extending a variable number of bars to the right of the gap.

image

The code hasn’t been optimized so that you can use the variables in subsequent code. While AFL has GapUp() and GapDown() functions the code below uses custom definitions to allow substitution of other criteria.

Numbering Bars

When you are developing systems and discussing charts with other traders by email, it is often convenient to be able to refer to the bars on your chart by number, date, or time. The code below can be appended to the end of your code to give you these options:

The b < Barcount check prevents out of range errors when you have AmiBroker Preferences set to give you a number of Blank bars at the right edge of your chart.

Plot(C,"",1,128); 
_SECTION_BEGIN("BAR LABELING"); 
ShowBars ParamToggle("Label Bars","NO|YES",0);
LabelCo ParamColor("Label",colorYellow);
Label ParamList("Bar Label","NUMBER|TIMENUM|DATENUM",0); 
GraphXSpace 10; 
if( Showbars ) 
{ 
DN=DateNum(); 
TN=TimeNum(); 
FirstVisibleBar Status"FirstVisibleBar" ); 
Lastvisiblebar Status("LastVisibleBar");  
for( FirstvisiblebarBN=0<= Lastvisiblebar AND BarCountb++) 
{ 
if( Label == "NUMBER" BarLabel NumToStr(BN++,1.0); 
else if ( Label == "TIMENUM" BarLabel NumToStr(TN[b],1.0); 
else BarLabelNumToStr(DN[b],1.0); 
PlotText("\n^\n"+BarLabel,b,L[b],LabelCo); 
} 
} 
_SECTION_END();


The labeled charts look like this:

Below a more streamlined version using the Switch():

_SECTION_BEGIN"BAR LABELING" );
PlotC""1128 );
ShowBars ParamToggle"Label Bars""NO|YES");
LabelCo ParamColor"Label"colorYellow );
Label ParamList"BarLabel""NUMBER|TimeNum|DateNum|BARNUM|WEEKDAYNUM|WEEKDAY");
GraphXSpace 10;

if ( Showbars )
{
    DN DateNum();
    TN TimeNum();
    WD DayOfWeek();
    WDList "SUN,MON,TUE,WED,THU,FRI,SAT";
    FirstVisibleBar Status"FirstVisibleBar" );
    Lastvisiblebar Status"LastVisibleBar" );

    for ( FirstvisiblebarBN 0<= Lastvisiblebar AND BarCountb++ )
    {
        switch ( Label )
        {
            case "NUMBER":
                BarLabel NumToStrBN++, 1.0 );
                break;
            case "TIMENUM":
                BarLabel NumToStrTN[b], 1.0 );
                break;
            case "BARNUM":
                BarLabel NumToStrb1.0 );
                break;
            case "WEEKDAYNUM":
                BarLabel NumToStrWD[b], 1.0 );
                break;
            case "WEEKDAY":
                BarLabel StrExtractWDListWD[b] );
                break;
            default:
                BarLabel NumToStrDN[b], 1.0 );
                break;
        }
        PlotText"\n^\n" BarLabelbL[b] - ( H[b] - L[b] ), LabelCo );
    }
}
_SECTION_END();

Edited by Al Venosa.

Measuring AFL Execution Times (v3)

When your code increases in complexity, it will start to execute more slowly, and you will eventually reach a point where you will want to optimize your code for speed of execution. Even if you are willing to buy a faster computer, it will rarely give you a greater speed advantage than optimizing your code.

Important note: The AmiBroker 5.01.1 beta released on 5/10/2007 offers a new profiling function that enables you to get accurate performance timing for all AmiBroker and custom functions called. It is available from the AFL Editor: Tools -> Code Check and Profile menu. To use this new tool effectively you should convert your code modules to function calls as much as possible. Try it!

The first requirement for analyzing your AFL execution speed is the ability to measure the execution times. This is best done using the GetPerformanceCounter(), which gives microsecond resolution. You can display the execution time in the chart Title, or log them to DebugView. To get an appreciation of how fast AFL executes you may want to time a few of your most frequently used AFL statements. As Tomasz pointed out in his comment to an earlier version of this post, this can be done using a simple loop:


<p>On my 2GHz laptopthe Param() takes about 4 microseconds to executeThe "Statement under test" can be any AFL statement or section of code you want to analyzeThis simple code will give you a fairly accurate idea of the true execution timePlease do not forget that all&nbsp;programs executing under Microsoft Operating Systems&nbsp;are subject to interruptionsThis means that your readings may fluctuate and will generally be greater than their absolute true valuesYour normal program executions are&nbsp;also subject to these interruptions and, if you perform&nbsp;precision timing tasksyour should consider their effect.</p> 

<p>If, in view of processing overheadyou prefer not to use DebugViewyou can log execution times either to the Interpretation screenwhich invokes an additional AFL execution, or to the chart Title if you output just a few measurements. Use of DebugView is outlined in several posts in the <a href="http://www.amibroker.org/userkb/category/real-time-auto-trading/debugging-afl/">Debugging AFL</acategoryWhen you are logging to DebugViewexecution times will be inflated by the amount of time needed to call and execute the _Trace() functionsYou can measure the timing overhead for a single&nbsp;_Trace()&nbsp;function using the same method we used above:</p> 


<p>On my 2GHz laptopthe _Trace() takes about 35 microseconds to executeCompared to the Param(), this would appear like a major errorbut in practice it is not. For examplewhen calling the&nbsp;_Trace() function thirty times in your codethis would add only about 1 millisecond to the overall execution time of your program. </p> 

<p>The example code below logs to DebugView and to the chart TitleIt uses a small Trace() function that is called each time you want to log a timing measurementYou can customize this function to log additional informationAlthough you can call this function on each lineyou do not have toCalling Trace() introduces a small measurement errorThis means that when you remove the measurement codeperformance should be slightly better than your measurements predict. If you do not use DebugViewyou can delete all DebugView related statements. If you do thisI suggest you comment them out until your modified code has been verified.</p> 

<p>Be careful when calling the Trace() from inside a loop. If your loop steps through 50,000 bars of datainserting one or more Trace() calls will slow down your code substantially and result in a significant measurement errorThe key to reasonable accuracy is to use the minimum number of _Trace() statements and keep them out of loops and frequently called functions.</p> 

<p>Inserting/removing TRACE() statements in a test program is easily done using the EditReplace function in the formula editorTo add _Trace() statementsreplace the ";" at the end of the line with "; TRACE("");":</p> <p align="center"><img height="178" src="http://www.amibroker.org/userkb/wp-content/uploads/2007/09/clip-image0023.jpg" width="351" border="0"></p> 

<p>To remove the _Trace() statements substitute "; TRACE("");" with ";":</p> <p align="center"><img height="178" src="http://www.amibroker.org/userkb/wp-content/uploads/2007/09/clip-image0043.jpg" width="351" border="0"></p> 

<p>Place your cursor just before the last ";" that precedes the first line of code you want to timeStop substitutions where you no longer want to time statementsYou should initialize the LineNumber to the line number that contains your first Trace() statementLine numbers for your cursor position are displayed at the right bottom of your editor screen.</p> 

<p>Here is a do-nothing program where _Trace() statements were added using the above methodYou can modify the function Trace() to output any information you like: 

<p>function TraceComment )</p> <p>{</p> <p>global LineNumberTitleStr;</p> <p>PC GetPerformanceCounterTrue );</p> <p>Str "# LN: "+NumToStr(LineNumber++,1.0,False)+", PC: "+NumToStr(PC,9.3)+" mSec., "+Comment;</p> <p>TitleStr TitleStr Str+"\n";</p> <p>_TRACE(Str);</p> <p>}</p> 
<p>

The output produced in DebugView looks like this:

dbvmeasurement.png

The output in the Title looks like this:

titlemeasurement.png

The first reading in the Title should be ignored as it initializes the PerformanceCounter. This reading is suppressed by the DBViewClear command in the DebugView log. The above method can be used to determine execution times of all AFL functions. Note that in the above example SetBarsRequired() is used to process all available data. This would be the worst-case measurement. Commenting out SetBarsRequired() will make your code execute under Quick-AFL. This may be significantly faster than running over all data.


Measuring Execution Order and Timing for Window Panes

When you are executing AFL formulas in multiple panes or windows and experience a timing problem, the first step to take, before using the above method, is to determine which pane uses up too much time. You can turn on Tools -> Preferences ->Miscelaneous -> Display Chart Timing to read the execution time at the bottom of the charts. Alternatively, the simple code below lets you log the execution order and time for the formulas in each open pane to DebugView. Since the AmiBroker Performance Counter readout is unique for each pane, the code below does not use it. In this case you will have to turn on Options -> Show Milliseconds in DebugView. This will give you Millisecond resolution, not micro-second as with the performance Counter and is a very approximate measurement. It should only be used to identify the problem formula. The execution order of the panes is revealed by the order in which the lines appear in the DebugView.

Filename StrLeft(_DEFAULT_NAME(),StrLen(_DEFAULT_NAME())-2);
function TraceChartID() 
{ 
Msg "# ChartID, "+NumToStr(GetChartID(),1.0,False)+", "+Filename;
_TRACEMsg ); 
return Msg;
} 

TraceChartID();

//
for(n=0n<BarCount;n++) ; // your code would be here
//

Title TraceChartID(); 

The Filename assignment and the TraceChartID() should be placed at the very top of your code, or you can add it to your default Include file. The single line used to call this function should be placed at both the beginning and the end of the code in each window/pane. This is what it looks like in DebugView:

dbvtrace.png

Edited by Al Venosa.

Yahoo’s Data Providers (v2)

Yahoo sources data from a number of providers who are acknowledged at the bottom of the Y!Finance page: http://finance.yahoo.com/ 

Yahoo001

The partner page link in that section opens a list of delayed intra-day data suppliers: http://finance.yahoo.com/exchanges

As well as that, other providers are acknowledged in other places e.g. the S&P500 index is provided by Comstock and industry information, “on 7500 publicly traded U.S. companies”, is from Hemscott Americas etc.

The obvious point is that there are, at the least, two historical quotes databases, a fundamental database and several delayed intra-day data streams used, in different ways and in different places, at the site and there is no relationship between them in anyway. Some pages are a compendium, sourced from different providers, and it is difficult to be certain, in some cases, what is coming from where.

The main points to be aware of:

  • 1) The intra-day quotes, for listings on the major US exchanges, come directly from the exchanges.
  • 2) Intra-day quotes, for non-U.S. listings, are supplied by third party providers e.g. Comstock and Telekurs.
  • 3) Fundamental data, for American exchange listings, is supplied by Capital IQ, a division of Standard and Poor’s.

Note: The Capital IQ  database is the logical choice as the underlying database for two stock screeners, although this is not confirmed at the site:

Java screener – http://screener.finance.yahoo.com/newscreener.html  

HTML screener –  http://screener.finance.yahoo.com/stocks.html 

At the time of writing the HTML database contains 8467 listings, but sadly only allows users to view screened lists 20 at a time, while the newer Java screener, which has superior exporting abilities, only references NYSE, Nasdaq and Amex stock i.e. 4370 listings.

Bulletin Board (.OB) listings are included in the HTML screener database but Pink Sheets symbols (.PK) are not (to obtain all listings for the databases run a filter using price >= 0 as the criteria).

  • 4) Historical data, for the U.S. markets, is supplied by Commodity Service Inc (CSI) and is updated after hours (in a trial conducted by the author the update was logged at 8 PM EST (USA) i.e. four hours after the close).
  • 5) Historical and delayed intra-day data for the non-U.S. markets is supplied by Hemscott Americas (historical data is updated after hours).

Note: International listings require a suffix to identify the exchange.

For a list of suffixes for each exchange refer to: http://finance.yahoo.com/exchanges

  • 6) The stock listings in the CSI (historical) database are not the same as for the Capital IQ (fundamental) database, or any other database for that matter. 
  • 7) Only one of the ‘databases’ has a downloadable index, albeit a limited download, while access to other resources at the site is on a symbol by symbol basis.

There is, however, the ‘mother of all indexes’ at: http://biz.yahoo.com/i/ (it seems likely that this index is provided by CSI, based on it’s size and content e.g. it is mainly comprised of US and Canadian listings and the number of constituents also approximates the CSI universe.

The patchwork nature of the site sometimes produces surprising outcomes. 

One example:

Japanese financial services company Acom Co Ltd is an ADR traded on the OTC market. It is not a constituent of the HTML screened list, and it does not have a ‘Yahoo’ chart. A search for the company by name, using Symbol Lookup, sometimes returns a result ……. 

Yahoo002

……….and at other times it doesn’t (pity about that).

Yahoo004

 In spite of all that it does have quotation and historical data at the Yahoo site.

Note:  To go to Yahoo!Finance site and enter ACMUY.PK in the Enter Symbol(s) input box and click on GET QUOTES at any Y!Finance page.

Yahoo002

Clicking on the Historical Prices link, in the Quotes section of the left hand side bar, will open approximately two years of data for this symbol. (Yes – Amiquote will download the data).

This is a result that is typical for OTC ADR’s.

All in all a mixed bag from Yahoo!Finance.

  • Version 1 – Sept21/2007
  • Version 2 – Sept23/2007 – Corrected minor errors and added links.

Written using Windows XPHome and Internet Explorer v7.

Screener – Nasdaq Stock

A stock screener that accesses an EDGAR Online database is available from the Nasdaq Exchange site.

http://www.nasdaq.com/

From the Homepage follow the Investor Tools >> Stock Screener link in the left hand sidebar to open the screener.

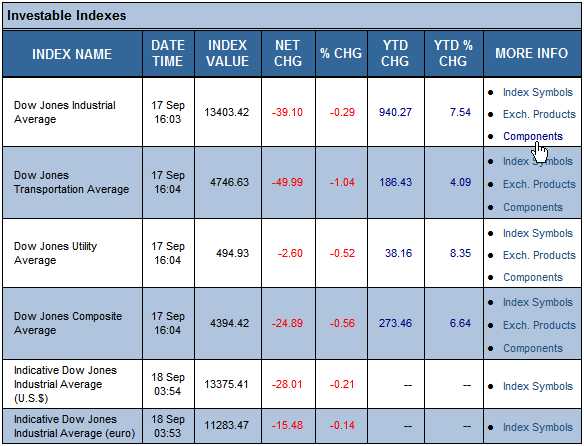
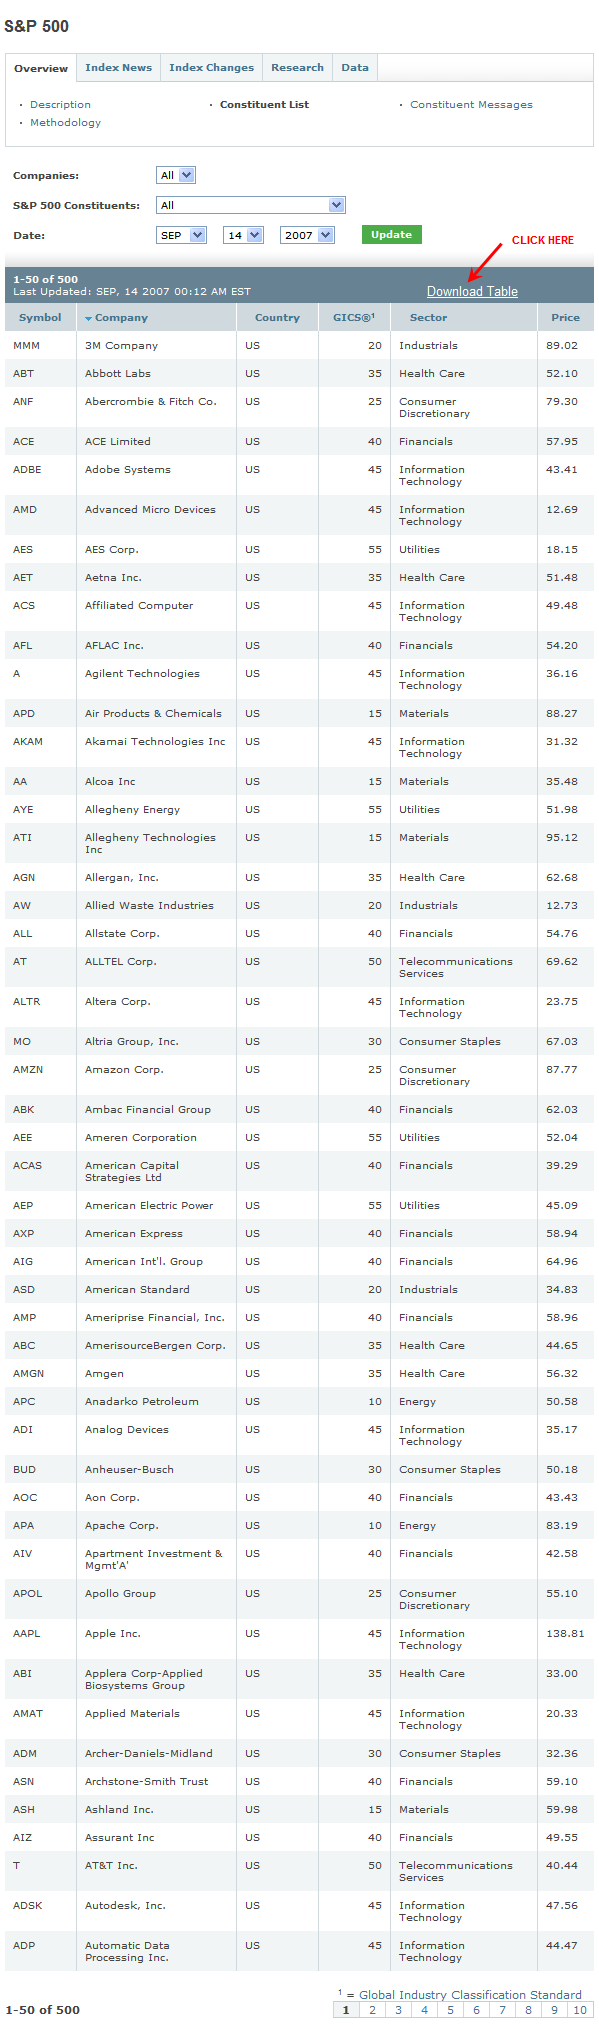
A list of constituents for several markets, including the  Nasdaq National and Capital Markets, can be obtained by searching.

To create a National or Capital Market list:

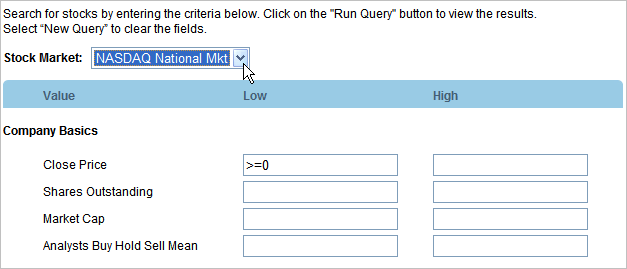
1) Open the Nasdaq screener.

2) Select the required market from the Stock Market drop-down list, enter >=0 into the Close Price input box, as the search criteria, and run the screen by clicking on the Run Query button at the bottom of the page (leave all the other input boxes blank).

NS001

An HTML list of stocks will be returned by the search.

3) Select all stocks in the HTML list, right click inside the selected area and pick Copy form the context menu that opens.

Note: To select all of the HTML list position the cursor on the last letter in the right hand bottom corner (this starts the selection with text rather than a hyperlink), left click the mouse button and drag the cursor up and across to the left while holding the left mouse button down.

4) Enter the copied list into a blank Excel spreadsheet using Paste Special as Text.

5) Manipulate the data into the required format using Excels built-in functions.

The list can then be converted from Excel to an AmiBroker compliant format as required.

To convert an Excel list into an AmiBroker compliant format:

1) Click on the title at the head of a column e.g. "A" (or columns) to select the contents.

2) Right click inside the selected area and pick Copy from the context menu that opens.

3) Paste the copied list into a text file, using a program like Notepad, and save it for later use.

OR

1) Delete any additional Worksheets (ASCII import will only recognize one Worksheet in a Workbook).

Note: Where extra Worksheets contain valuable information make spare copies of the file first.

2) Delete any extraneous material in the lists e.g. comments, redundant columns or additional headers or footers.

Note: As a precaution copy any ‘wanted’ columns that have underlying formulas and Paste Special as Values first to ‘preserve’ the data i.e. change it to a permanent, independent format.

3) Save As a Comma Separated Values (CSV) file for later use (also known as Comma Delimited).

Note: When an Excel file, that contains one Worksheet, is saved as a CSV file the Worksheet will automatically be renamed to match the filename.

WARNING: ASCII IMPORT WILL STRIP ADDITIONAL WORKSHEETS FROM A WORKBOOK IF THEY ARE NOT MANUALLY REMOVED FIRST.

The attached file contains raw data and example formulas for changing the format of Nasdaq screened downloads (a basic knowledge of Excel and Excel’s functions is assumed).

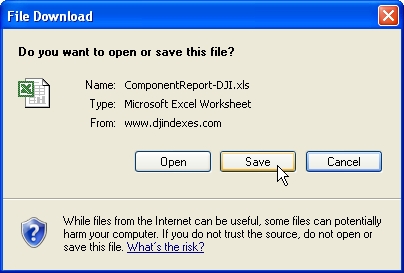
Right click on the attached file and Save Target As to download it to a local drive.

ATTACHED FILE:

Nasdaq screened list    nasdaqmarketssept2007.xls


Written using Windows XPHome, Internet Explorer v7 and Excel 2002.

Indexes – Dow Jones

http://www.djindexes.com/

Home of the most famous family of indexes in the world.

Like all of the ‘index sites’ there is a lot of information available there but the objects of interest, for this post, are index component lists.

To download DJ component lists:

1) Go to the HomePage >> Indexes >> Dow Jones Averages to open the Dow Jones Averages page or follow the  link:

http://www.djindexes.com/mdsidx/?event=showAverages

2) Click on the Components link in the MORE INFO column.

DJ001

A Download File window will open.

DJ002

3) Save the file to a local drive.

Since 2004 on, Dow Jones has also managed the Wiltshire indexes, a group of indexes based on the Dow Jones Wiltshire 5000 which comprises "all U.S. equity securities with readily available prices".

The Wiltshire indexes can be linked to  from the Dow Jones homepage and the partner page for the indexes is: http://www.wilshire.com/Indexes/ 

The component lists for the indexes are only available by subscription.

Data Resources – Fundamental

A list of unqualified data resources with a bias towards EOD, or longer term, equity related data (mainly for the American market). The majority provide fundamental data of some kind with a percentage providing fundamental data alone. Some sites do provide equity data, and data for other financial instruments, as well.

The list is dynamic and subject to change without notice.

The list is ordered according to when the author researched the site and it is not sorted by rank or order of merit.

CAUTION – MOST OF THE LINKS CONTAIN COMMERCIAL REFERENCES OR LINK TO COMMERCIAL SITES.

NOTE: THE AUTHOR HAS NO COMMERCIAL AFFILIATIONS OF ANY KIND AND RECEIVES NO GRATUITIES, OR BENEFITS, FROM ANY COMMERCIAL ORGANIZATION OR INDIVIDUAL INVOLVED IN COMMERCIAL ACTIVITIES. NOR IS HE PERSONALLY ENGAGED IN ANY COMMERCIAL ACTIVITIES, RELATED TO TRADING, IN ANY WAY. THE LINKS ARE PROVIDED AS A RESOURCE AND FOR EDUCATIONAL PURPOSES. THEY ARE NOT A RECOMMENDATION, ON THE PART OF THE AUTHOR, NOR DO THEY CONSTITUTE INVESTMENT ADVICE AND SHOULD NOT BE CONSTRUED AS SUCH.

1) Commodity Systems Inc

http://www.csidata.com/

EOD and historical databases for:

  1. North American and World futures (Commodities).
  2. U.S. and non-U.S. stocks and stock indices (mainly Canada and U.K).
  3. Options on World indices
  4. Futures options.
  5. Mutual Funds.
  6. Briese’s Commitment Of Traders (COT) data.
  7. Single stock futures.
  8. Plus many fundamental and econometric series such as interest rates and housing starts.
  9. Data for de-listed stocks available by subscription.
  10. Long historical databases available.
  11. and more.

Downloadable text files for the current constituents of the supported ‘markets’.

http://www.csidata.com/csi/exchangelist/index.html


An old list – overdue for maintenance.

1. most likely sites for exportable historical fundamental data

http://betterinvesting.stores.yahoo.net/23303.html
http://nt3.zacks.com/default.htm
http://online.barrons.com/public/main
http://sec.freeedgar.com/
http://today.reuters.com/news/home.aspx
http://www.aaii.com/stockinvestor/intro/
http://www.angelfire.com/in/vestinukgrowthshares/cdrefs.html
http://www.aspecthuntley.com.au/af/home?xtm-licensee=aspecthuntley
http://www.capitaliq.com/
http://www.cbs.curtin.edu.au/index.cfm?objectId=1B3273A3-0C32-2E2E-4B5B799689FF74FC
http://www.crsp.chicagogsb.edu/
http://www.exchange-data.com/products/fundamental_data.aspx
http://www.fisonline.com/
http://www.fordequity.com/html/pr_data_usdaily.htm
http://www.globalfinancialdata.com/index.php3
http://www.hemscottdata.com/
http://www.iclub.com/products/p_investing.asp
http://www.investmenteasy.com/home.aspx
http://www.itisacapitalmistaketotheorizeinadvanceofthefacts.Sherlock Holmes
http://www.market-eye.co.uk/
http://www.marketdata.sungard.com/
http://www.msodata.com/
http://www.perfectinfo.com/product_detail.asp?productid=4
http://www.qaisoftware.com/index.html
http://www.qcharts.com/default.asp
http://www.rimes.com/index.xmp
http://www.securities.com/
http://www.shortsqueeze.com
http://www.tbsp.com/public/default.htm
http://www.thomson.com/index.jsp
http://www.trackdata.com/
http://www.tradetools.com/web/scripts/default.asp
http://www.valueline.com/
http://www.wvb.com/
http://www.zacks.com/
http://www2.standardandpoors.com/servlet/Satellite?pagename=sp/Page/HomePg&r=1&l=EN&b=10

2. additional sites with fundamental data available

http://webcenters.netscape.compuserve.com/menu/default.jsp
http://www.annualreportservice.com/
http://www.comstock-interactivedata.com/index.shtml
http://www.cqg.com/
https://www.etradeaustralia.com.au/Application/Index.asp? (broker, account holders only).
http://www.hoovers.com/business-information/–pageid__4453–/free-index.xhtml
http://www.iqfeed.net/
http://www.qp2.com
http://www.smartmoney.com/mapstation/
http://www.stocksmart.com/pls/ri/home
http://www.stockwiz.com
http://www.telekurs.com/tkhoch_home.htm
http://www.trendvest.com/

3. Investment Clubs.

http://betterinvesting.stores.yahoo.net/23303.html
http://www.aaii.com/stockinvestor/intro/
http://www.angelfire.com/in/vestinukgrowthshares/cdrefs.html
http://www.iclub.com/products/p_investing.asp

4. Current fundamental data only (bundled with price data)

http://www.iqfeed.net/
http://www.qp2.com

5. UK

http://www.angelfire.com/in/vestinukgrowthshares/cdrefs.html
http://www.market-eye.co.uk/

6. AU

http://www.aspecthuntley.com.au/af/home?xtm-licensee=aspecthuntley
https://www.etradeaustralia.com.au/Application/Index.asp? (broker, account holders only).

version 1 – Sept2007

Indexes – Standard and Poor’s

Standard & Poor’s (S&P) manage a range of U.S. and global indexes including ‘headline’ equity indices for the U.S., Canadian and Australian markets.

The http://www2.standardandpoors.com site is a portal to international S&P sites. Index lists and information on indices and investment related matters is available from the  various sites.

This article solely references the U.S. site to download a current S&P500 constituent list.

To download an S&P500 constituents list:

1) Go to U.S. Homepage  >> Indices >> Equity Indices >> United States and select S&P500 from the Major Indices HTML list. (This opens an S&P500 information panel with Overview as the default) or take the shortcut:

http://www2.standardandpoors.com/portal/site/sp/en/us/page.topic/indices_500/2,3,2,2,0,0,0,0,0,1,3,0,0,0,0,0.html

Note: Additional information on the S&P500, including Index Changes, can be obtained by clicking on the alternative tabs.

2) Click on Constituents List in the Overview sub-panel.

SandP001

3) Click on the Download Table link in the header of the list that opens.

SandP001

A Download File window will open.

SandP002

4) Save the file to a local drive.

An example AmiBroker application that uses an S&P download will be included in future posts.

ATTACHED FILE:

S&P500 Constituent List: sandp500sept2007.xls 

Note: The file was uploaded as an Excel file as the CSV file-type used, in this case, did not pass the site upload security filter.

Written using Windows XPHome, Internet Explorer v7 and Excel 2002.

Indexes – Russell

The Russell Investment Group produces a range of Global and U.S. equity indexes.

At their http://www.russell.com/Indexes/ site they have the following to say about their American indexes:

"Russell produces a family of U.S. equity indexes. The indexes are market cap-weighted and include only common stocks incorporated in the United States and its territories. All U.S. indexes are subsets of the Russell 3000E Index, which represents approximately 99% of the U.S. equity market…..Excluding stocks trading below $1.00, pink sheet and bulletin board stocks, closed-end mutual funds, limited partnerships, royalty trusts, etc, non-U.S. incorporated stocks, foreign stocks, American Depositary Receipts (ADRs)".

For additional information on the Russell Indexes refer to: http://en.wikipedia.org/wiki/Russell_Indexes

Detailed information, including methodologies and membership lists, is available from the above link or the Russell home site: http://www.russell.com/us/SiteNav.asp

To obtain membership lists for the US market go to the HomePage >> Indexes >> Index Membership >> Membership Lists or follow the link: http://www.russell.com/Indexes/membership/default.asp

The lists are downloadable in PDF format.

To manually extract AmiBroker compliant component lists from the PDF files:

  • 1) Open the PDF and change the View >> Page Layout to Continuous from the Adobe Reader menu bar.
  • 2) Pick Select All and then Copy, (also from the Adobe Reader menu bar).
  • 3) Paste the copied selection into a blank Excel worksheet and manipulate the data using Excels built-in functions.

An example list can be downloaded by right clicking on the link below and clicking on Save Target As to save the file to a local drive.

Note: The attached file assumes a basic knowledge of Xcel and Xcel functions.

ATTACHED FILE:

Russell (US) 3000 Index:  russell3000.xls


Written using Adobe Reader v7.0 and Xcel 2002

Sector Classifications – Hemscott (v2)

Hemscott Inc is the owner of the stock classification system used by Yahoo at their Y!Finance (USA) site as well as by other data providers.

As AmiBroker user Dick Hoierman noted in a recent AmiBroker group discussion;  "Hemscott has more or less become the standard as TC2007 and others have switched to it." which makes the topic one of interest for many AmiBroker owners.

Interested readers can find  Hemscott Industry Group listings at the Hemscott site: http://www.hemscottdata.com/ 

To access the list go to the Homepage >> Financial Databases >> North American Industry Groups >> Hemscott Industry Groups which is the path to an HTML version: http://www.hemscottdata.com/fin_database/na_hemscott_industry_group.html 

Unfortunately a downloadable version is not available at the site but a ‘working’ version can be obtained by manual, albeit tedious, means.

To make a text copy of the HTML list:

  • 1) Manually select and copy the relevant ‘text’ from the web page.
  • 2) Paste it into a blank Xcel worksheet.
  • 3) Use the copy, paste, delete, sort features and text functions to manipulate the data into the desired format.
  • 4) Once the lists are suitable for use as an AmiBroker industry, or sector file, select a column, copy the contents and paste it into a text editor e.g. NotePad.
  • 5) Save the text file in the C:/Program Files/AmiBroker folder (or the equivalent) as Hemscottbroker.industries or Hemscottbroker.sectors for use as required.

To download a spreadsheet, or a text file, with the current listings right click on the links below and select Save Target As to download them to a local drive.

Note: The spreadsheet is ‘raw’ and assumes a knowledge of basic Xcel and Xcel functions (refer to the Notes worksheet for instructions). The text files are intended as ‘Master’ copies as they contain lists with different ‘formats’. Users need to delete the unwanted sections from the text files.

ATTACHED FILES:


  •  Version 1 – Sept14/2007
  • Version 2 – sept16/2007 – instructions rewritten – updated attached files to include additional workings and AmiBroker compliant numbering
  • Written using MicroSoft XPHome, Internet Explorer v7 and Excel 2002.

    1 Dick Hoierman – AmiBrokerYahooGroup – message #115044 – US-Stocks database template

Next Page »