August 13, 2007
IO – Robustness, A Sensitive Subject
This page is obsolete
Almost all who have been trading for more than a short while have come to realize that without additional information, In Sample Optimization results are purely for bragging rights and as such have very little predictive capability for how some system is likely to perform where it counts … Out of Sample.
One of the important pieces of information we can utilize to have some clue as to whether or not a system is likely to perform well out of sample is to take a look at how sensitive the parameter values we have chosen are. With a two parameter system we can in AmiBroker optimize the system using traditional methods and then look at the 3d surface area plots that put the two parameters on the x and y axis and some performance metric on the z axis like in the chart below.
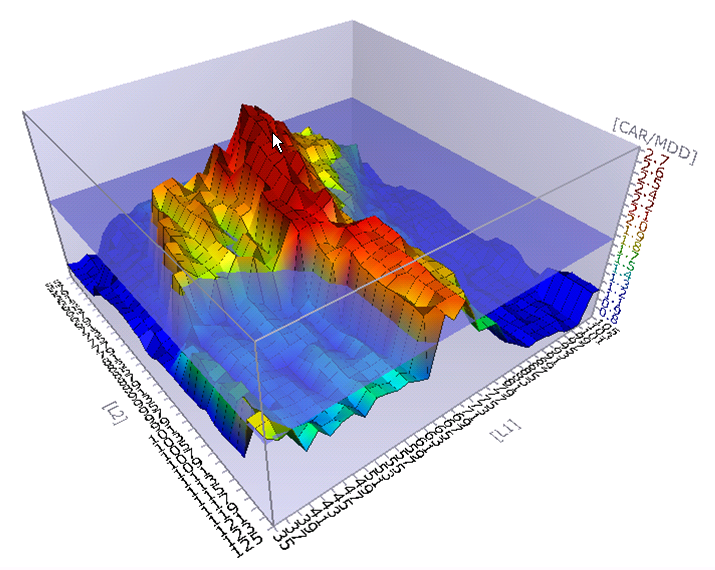
As in the chart above it is not uncommon for the highest peak to be immediately next to an area where system performance falls off significantly. The parameter values representing this peak then could be referred to as being too sensitive or not particularly robust. While this might be a very good system we would not want to use the parameter values that put us right at that peak as the probability of failure or at least significantly different results in real trading is too great. We would want instead to select parameter values that while still performing well In Sample also had a higher probability of performing well Out of Sample because they weren’t as sensitive. This could be illustrated by where I’ve placed the arrow in the above chart.
While the 3d surface area plots in AmiBroker are fine for visualization of Sensitivity and then to at least some degree Robustness with 2 parameter systems, they won’t help when one is trying to understand the Sensitivity of parameter values with systems that have 3 or more parameters. One way to have some idea of how sensitive the parameter values are with systems that have 3 or more parameters is to take a statistically significant number of points and randomly generate values for each of the parameters that represent those points in some percentage range that is plus or minus from the original point, test those for fitness and then compare the results to the fitness of our original point. For example in the above chart let’s assume that the parameter values for L1 and L2 as represented by where I placed the arrow are at 75 and 70 respectively and we chose for our range to randomly test other points in the +/- 5% range. We could then test points with values for L1 varying from ~71 – 79 and for L2 varying from ~66 – 74. This would give us data that could then be plotted in a different way that showed us how sensitive those parameters are. Below is an example of such a plot using a bar chart to categorize groups of points and their fitness relative to the fitness of our original parameter values found in optimization.
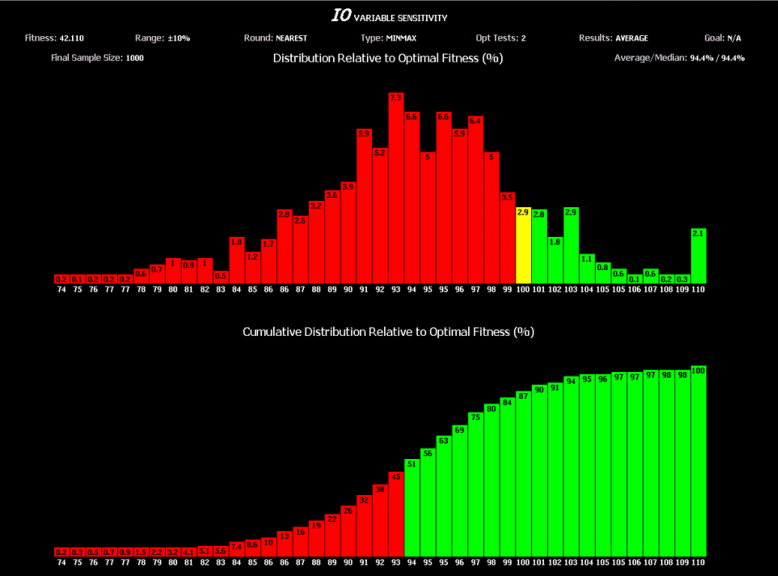
The top section of the chart shows categories and percentages of points tested and for example the tallest bar shows that 7.3% of the points tested had fitness that was 93% as good as our original point. Also notice that since the fitness of the original point we picked was not the highest peak in the original 3d surface area plot, that some bars in the chart above have a higher than 100% value. The bottom section of the bar chart is composed of cumulative values from the top section and for example shows that 45% of our tests were less than 93% as good as our original point. While this tool may not appear to be quite as useful as the surface area plots, keep in mind that it is valid regardless of the number of parameters being optimized.
The above are standard shareware features in IO.
Given that unlike Exhaustive Search an Intelligent Optimization methodology will by its nature not examine every possible combination of parameter values, it would be unlikely without some additional influence or direction that the Intelligent Optimization process would have picked for parameter values those that were not particularly sensitive. This is because the processes of judging or calculating parameter sensitivity are typically performed after the optimization was finished because with Exhaustive Search that is all that is required as we had a chance to view the results of all combinations.
In order to ensure that parameter sensitivity is taken into account when looking for parameter values with high fitness utilizing an Intelligent Optimizer, it is necessary to have a methodology for evaluating how sensitive parameter values are and to have that in turn impact the fitness calculation during the optimization process so that the process is led to a more robust set of parameter values.
Given that the Intelligent Optimization process as implemented in IO sends parameter values to AmiBroker for evaluation by its optimizer and retrieves results back from AmiBroker to determine how it should alter its search pattern in the next generation, this is more straight forward then it would first appear. This is accomplished by between one generation of regular optimization and the next looking at the results coming back from AmiBroker and for those points that are worth further examination performing some tests for Sensitivity that are not dissimilar to the methodologies used to generate the bar charts above. The IO options and mechanics for this while not difficult for the user to employ are varied and fairly sophisticated and as such rather than discuss all of them here I would recommend for those who are interested that you read the sections on Sensitivity in the full documentation.
The above are advanced features in IO.
A shareware version of IO with full documentation can be found in the AmiBroker Files Section …
http://groups.yahoo.com/group/amibroker/files/IO.zip
 Filed by Fred at 5:43 am under Intelligent Optimization
Comments Off on IO – Robustness, A Sensitive Subject