Data Holes in Real-Time Trading

When AmiBroker doesn?t receive data during regular trading hours, the missing period or bar is referred to as a Hole in the data array. Holes can occur when a ticker isn?t trading or when the data feed is interrupted. They can last for any length of time and can occur in any timeframe.

When a bar has no data, the bar is not added to the database. The database record simply skips to the next bar-period. Holes may be filled in during backfill or when the data provider transmits data corrections. When this happens, the database is updated.

When plotting Indicators based on the selected current symbol, holes are skipped to create continuous looking charts. Because of this you cannot visually detect any holes. However, as will be explained below, this is not the case when plotting foreign data.

While AmiBroker never modifies the data it collects and stores in your database, it may fill in and fix holes during operations that require a common time base. Such operations would include several AA functions, the creation of composites, and chart overlays. The process of fixing and padding data to allow these operations is called data alignment.

Data Alignment in the AA

In Automatic Analyzer (AA) operations, data Alignment can be turned On/Off and the Reference Symbol to be used for alignment can be specified. This is explained in the AFL Function Reference quoted below:

?Pad and align to reference symbol

When this is turned on, all symbols’ quotes are padded and aligned to reference symbol. Note: by default this setting is OFF. Use responsibly. It may slow down backtest/exploration/scan and introduce some slight changes to indicator values when your data has holes and holes are filled with previous bar data. The feature is intended to be used when your system uses general market timing (generates global signals based on data and/or indicators calculated using Foreign from ‘reference’ symbol) or when you are creating composites out of unaligned data. Note: if reference symbol does not exist, data won’t be padded.?

Data alignment in Indicators

Foreign data used in Indicator formulas are aligned to the current symbol and not, as is the case in the AA, to the Reference symbol specified in the AA Settings. Depending on the value of the fixup parameter of the Foreign() function, data holes can be handled in any of three ways. This is explained in the AFL Function Reference as follows:

?The last parameter – fixup – accepts following values

  • 0 – the holes are not fixed
  • 1 – default value – missing data bar OHLC fields are filled using previous bar Close, and volume is set to zero.
  • 2 – (old pre-4.90 behaviour) – causes filling the holes in the data with previous O, H, L, C, V values

The fixup parameter of 2 is provided to maintain compatibility with earlier AmiBroker releases and should not be used when developing new code.?

Holes in Real-Time Portfolio-Trading

When executing an RT portfolio trading system from an Indicator window, you typically loop through the portfolio tickers and use the Foreign() function to access data for each ticker as it is selected. Since both the current and the foreign tickers may have holes, there are a variety of hole conditions to deal with. Holes and padded bars may appear and disappear from your chart depending on the value of the fixup parameter and whether the current or foreign ticker has holes. Charts may also change during RT backfills. Since the plotted data are the same data used in your formulas, you have to be cautious about how you use foreign data.

The criteria to detect holes are simple: if the Volume equals null, the data are missing (hole); if the Volume equals zero, the data are padded (filled hole); and if the Volume is greater than zero, the data are true (no hole).

Since foreign data are aligned to the current ticker in Indicators, it can be stated that:

? If the current ticker has no data for a particular bar, the corresponding bar-interval for the foreign array will not be displayed and will not be available for calculations. This blocks foreign data and could result in missed signals.

? If the foreign ticker has no data for a particular bar while the corresponding bar for the current ticker has data, a bar will be added to the foreign array. If fixup is turned On, this bar will be filled with prices from the previous foreign bar. If you use Intraday signals, this could result in extra or duplicate signals.

It is obvious from the above that to design a robust High-Frequency Real-time portfolio trading system that executes in the Indicator window, you must consider the effect of holes on your signals.

Detecting Holes

To detect all holes perfectly, you need a perfect reference ticker, i.e., one that trades every minute of the day for every trading day of the year. If such a perfect ticker existed, you would make this your current ticker so that all foreign data would be aligned to it. Simply checking for zero volume would identify all holes. However, since such a perfect ticker does not exist in reality, if you assume that a ticker is perfect, you are simply transferring the hole problem from one ticker to another, and you wouldn’t be any closer to solving the problem.

A perfect solution would be to use a linear Date Reference Array that has bars for all calendar days. Such an array is documented in the post titled ?Date Calculations? on this site. To apply a linear Date Reference Array to detect holes is beyond the scope of this post, but it may be covered in a later post.

Another reasonably good solution is to use a high volume ticker, like the QQQQ, for your current ticker. The problem is that even the QQQQ has low volume periods and may contain holes.

A slightly better solution is to create a Volume composite for a group of actively traded tickers, perhaps from different markets, and make it your current symbol. For this composite to have a Hole there would have to be a period during which none of the tickers traded. While this is unlikely to happen in longer time frames, it can still happen in very short time frames, making this solution imperfect also. This solution will be used here to create a chart that displays (maps) the existence of holes for an entire WatchList all at once.

The demo code below uses a separate WatchList for the composite and the tickers to be mapped. To prevent a slow response (perceived as lockup by many) when large numbers of tickers are mapped, or when you inadvertently select a very large WatchList, you can set a maximum number of tickers (defaults to 50). You should only use high volume tickers for the composite WatchList since lightly traded tickers are unlikely to add any bars to the composite.
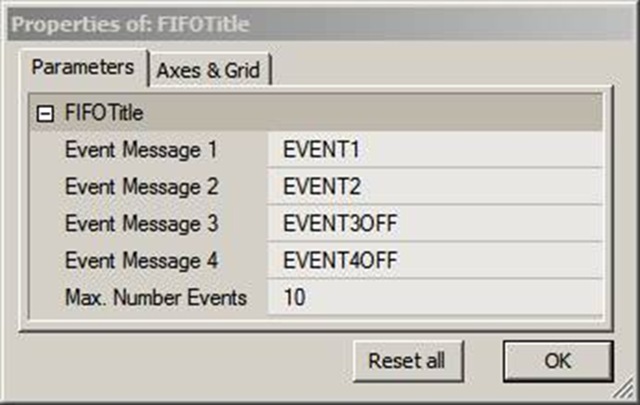
Program Parameters

The Param window for the demo code has the following options:

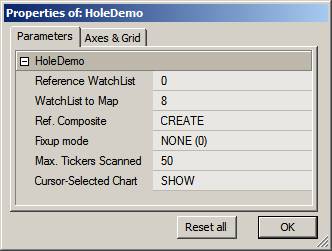
The Reference Watchlist (0-based) should point to the group of tickers used to create the composite. You should always click UPDATE after changing the Reference Watchlist to create a new composite for the new Watchlist.

The Watchlist to Map selects the watchlist to be tested for holes. Each ticker in this watchlist will add a horizontal line to the chart. This would normally be your portfolio watchlist. Holes are indicated using a digit surrounded by a small circle. The digit is the fixup parameter used in the Foreign() to retrieve that data.

The occurrence of any digit shows the location of a hole. A 0 digit means the bar is Null or Empty, and no bar will show; a digit of 1 means that the bar was padded with only the C price from the previous bar; a digit of 2 means the data was padded with OHLCV (obsolete method!) data from the previous bar.

You can observe how holes are replaced with data from the previous bar. An empty bar is replaced with a bar identical to the preceding bar when you vary the fixup parameter in the Param window.

To demonstrate how a different Reference ticker changes the distribution of holes, you can open your workspace and step through (make current) different tickers in your database. The program checks the cursor position, and if you set Cursor-Selected Chart to SHOW (rather than HIDE), a price chart will be overlain on the chart for the selected ticker line. This allows you to zoom in and inspect prices in the immediate area surrounding the Hole or Padded data.

Note: Since there is no way to detect which pane the cursor is on, the cursor-position sensing will work only if the hole map is run in its own window.

Typical Hole-Maps

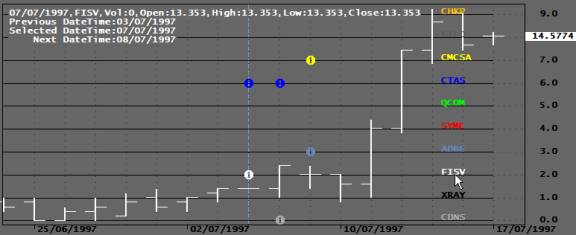
I the captures below, a NASDAQ 100 (N100) composite was used as reference for the ticker FISV. Each ticker in the chart (hole-map) below is assigned a horizontal time line on which the existence of holes is indicated with a small circle. Placing your cursor on a hole displays its date and data in the title. The color of the circles matches that of the ticker. The Y-axis numbers are the ticker numbers (redundant).

In the first case, the fixup parameter was set to zero and the bar location with missing bar is left empty (see cursor location). Because the digit is so small it may look like a ?1?, but it is actually a ?0?. The fact that a bar is missing means that the current symbol had data for this bar but the foreign ticker did NOT.
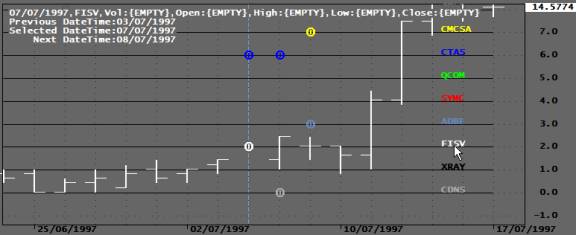
Fixup mode ‘0’

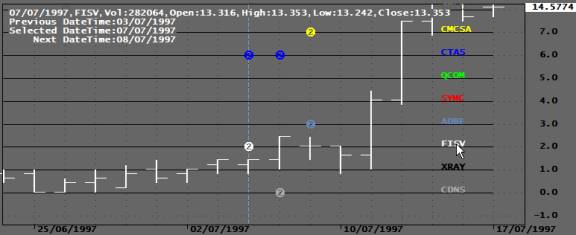
In the next capture a fixup parameter of 1 is used, and the missing bar is filled with the C price from the previous bar while the Volume (not shown) is set to zero.

Fixup mode ‘1’

In the next capture, the fixup parameter is set to 2, which results in the missing bar being Filled with OHLCV values from the previous bar.

Fixup mode ‘2’

In all the above examples, an EOD chart was used. However, it could just as well have been a 1-minute chart (or any other timeframe). Here is the code that produced the above charts:

RequestTimedRefresh(1);
GraphZOrder=True;
GraphXSpace 10;
RefWLNum Param("Reference WatchList",0,0,64,1);
MapWLNum Param("WatchList to Map",8,0,64,1);
ScanTrigger ParamTrigger("Reference Composite","CREATE COMP");
ShowChart ParamToggle("Cursor-Selected Chart","HIDE|SHOW");
FixupSelection ParamList("Fille Type (Fixup)","NO FIXUP (0)|PREVIOUS C to OHL (1)|PREVIOUS OHLCV (2)");
TMax Param("Max. Number Tickers Scanned",50,1,200,1);
if( FixupSelection == "NO FIXUP (0)" FixupFlag 0;
else if( FixupSelection == "PREVIOUS C to OHL (1)" FixupFlag 1;
else if( FixupSelection == "PREVIOUS OHLCV (2)" FixupFlag 2;
MapTickers CategoryGetSymbols(categoryWatchlist,MapWLNum);
FirstVisibleBar Status("FirstVisibleBar");
Lastvisiblebar Status("LastVisibleBar");
XText Lastvisiblebar-(Lastvisiblebar-FirstVisibleBar)/10;
if( ScanTrigger )
{
RefTickers=CategoryGetSymbols(categoryWatchlist,RefWLNum);
for( T=0; (symbol=StrExtract(RefTickers,T))!="" AND &ltTmaxT++ )
{
Vt=Nz(Foreign(Symbol,"V",False))>0;
AddToComposite(VT,"~MarketVolume","V",1|2|128);
}
}
else
{
for( T=0; (symbol=StrExtract(MapTickers,T))!=""T++ )
{
VT1Foreign(symbol,"V",FixupFlag);
F0 IsNull(VT1);
F1 VT1 == 0;
F2 VT1 == Ref(VT1,-1);
VT Nz(VT1);
if(T>15Co int(T/15)*15; else Co T;
Plot(T,"",colorBlack,styleLine|styleNoLabel);
PlotShapes(IIf(F0,shapeDigit0,IIf(F1,shapeDigit1,IIf(F2,shapeDigit2,shapeNone))),Co,0,T,0);
PlotText(""+symbol,XText,T,Co);
}
}
DT=DateTime();
TickerNumber=round(GetCursorYPosition());
SelectedTicker=StrExtract(MapTickers,TickerNumber);
DateTimeNum=GetCursorXPosition();
if(TickerNumber>15)Co=TickerNumber-int(TickerNumber/15)*15;else Co=TickerNumber;
SetForeign(SelectedTicker,FixupFlag);
if(ShowChartPlot(C,"",Co,styleBar|styleOwnScale|styleThick);
if( SelectedTicker == "" SelectedTicker Name();
Title="\n"+EncodeColor(Co)+
NumToStr(SelectedValue(DT),formatDateTime)+","+SelectedTicker+",Vol:"+NumToStr(V,1.0,False)+","+
"Open:"+NumToStr(O,1.3)+","+"High:"+NumToStr(H,1.3)+","+"Low:"+NumToStr(L,1.3)+","+"Close:"+NumToStr(C,1.3)+"\n"+
"Previous DateTime:"+NumToStr(Ref(DT,-1),formatDateTime)+"\n"+
"Selected DateTime:"+NumToStr(DT,formatDateTime)+"\n"+
" Next DateTime:"+NumToStr(Ref(DT,1),formatDateTime);

Edited by Al Venosa

A Real-Time Message FIFO

Real-time messages often appear on your screen only for the duration of a single chart-refresh interval and disappear before you have time to read them. The FIFO (First In First Out) n-line display presented here captures and scrolls messages in the chart Title so that they are easier to read. Logging messages to DebugView or the Interpretation window would require opening additional windows. Using the Title instead displays the messages right on the chart and is more space-efficient.

A typical application would be to display real-time system status, such as order status, TWS error messages, partial fills, account balance, profits, etc.

Since the chart Title does not support formatting, it is advisable to use a mono-spaced font, such as Lucida Console, and pad spaces to create columns. The integer part of the NumToStr() formatting parameter sets the overall length of the returned string and can be used to format columns. If you prefer more font and color options, you can use Gfx functions to display the messages.

To prevent Title wrapping, you can truncate messages using the StrLeft() function. This works well for TWS error messages that can be long but carry the important info at the left of the error message. The demo below uses a simple PadString() function to space short messages in columns.

The AddToFIFOTitle() function is called whenever you want to add a message to the table. Its first argument is the name of the static variable that contains the table, the second argument is the message you want to add to the table, and the third is the maximum number of lines in the table. Setting the third argument to zero clears the table.

To keep things simple, the code below uses Param functions to simulate real-time messages; in a real system, these messages would be generated by real-time events. To test the code, click any of the numbered Event Messages in the Parameter window.

clip_image002

The Title produced should look like this:

clip_image004

Note that messages in this example are padded to position the next column properly. The order of the messages is inverted to allow the last message to appear at the top of the message table. Whenever the maximum number of lines is exceeded, the oldest message is removed. To ensure that the table is updated at least once a second you should always include a RequestTimedRefresh(1) in your code.

Finally, in Automated Trading you don’t always need charts, and you may prefer to display only a status table. Since the table is stored in a global Static Variable, you can read the table from any pane or window using just two lines of code:

RequestTimedRefresh);
Title "\n"+StaticVarGetText("FIFOTitle");

If you use several scrolling displays in different panes, you should key the Static Variables as explained in Keying Static Variables. The complete demo code follows:

function padStringStringColWidth )
{
SpaceFill " ";
if( String == "{EMPTY}" String "";
SL StrLen(String);
NS StrLeft(SpaceFillColWidth-SL);
return string+NS;
}

function AddToFIFOTitleStrNameStrMaxItems )
{
// Add New item
NewString "";
PrevStr StaticVarGetTextStrName );
ItemCount Nz(StaticVarGet("NumberItems"));
if( MaxItems == )
{
StaticVarSetText(StrName"");
StaticVarSet("NumberItems",0);
S1 "";
}
else if( Str != "" )
{
StaticVarSet("NumberItems",++ItemCount);
NewTitle NumToStr(ItemCount,3.0,False)+". "+Str "\n"PrevStr;
for(s=0n=0S1=""; ( s2=StrMid(NewTitle,s,1) ) != "" AND &ltMaxItemss++ )
{
S1 S1 S2;
if( S2=="\n" n++;
}
}
else S1 PrevStr// come here when Str == ""
StaticVarSetText(StrNameS1);
return StaticVarGetText(StrName);
}

RequestTimedRefresh);
// Simulate Transient (Trigger) Events
Event1 ParamTrigger("Event Message 1""EVENT1");
Event2 ParamTrigger("Event Message 2""EVENT2");
// Simulate State events and convert to triggers
PrevEvent3 Nz(StaticVarGet("Event3") );
Event3 ParamToggle("Event Message 3""EVENT3OFF|EVENT3ON",0);
StaticVarSet("Event3",Event3);
Event3Trigger Event3 != PrevEvent3;
PrevEvent4 Nz(StaticVarGet("Event4") );
Event4 ParamToggle("Event Message 4""EVENT4OFF|EVENT4ON",0);
StaticVarSet("Event4",Event4);
Event4Trigger Event4 != PrevEvent4 ;
MaxEvents Param("Max. Number Events",5,0,20,1);
if( Event1 )
{
Msg1 PadString"EVENT1 MSG"15)+Now(2);
AddToFIFOTitle"FIFOTitle"MSG1MaxEvents );
}
if( Event2 )
{
Msg2 PadString"EVENT2 MSG"15)+Now(2);
AddToFIFOTitle"FIFOTitle"Msg2MaxEvents );
}
if( Event3Trigger )
{
Msg3 PadStringWriteIf(Event3,"E3-ON MSG","E3-OFF MSG"), 15)+Now(2);
AddToFIFOTitle"FIFOTitle"Msg3MaxEvents );
}
if( Event4Trigger )
{
Msg4 PadString(WriteIf(Event4,"EVENT4-ON MSG","EVENT4-OFF MSG"), 15)+Now(2);
AddToFIFOTitle"FIFOTitle"Msg4MaxEvents );
}
Title "\nFIFOTitle Demo\n\n"+AddToFIFOTitle"FIFOTitle"""MaxEvents);

Edited by Al Venosa

Time Calculations

Time calculations are needed when placing GAT (Good At Time) and GTD (Good Till Date) orders. The simplest way is to convert the TimeNum to a SecondNum, perform your calculations in Seconds, and then convert the SecondNum back to a TimeNum. The first two functions below will do that for you.

The next function applies a reference expressed in seconds to your Reference time. This reference would typically be used to Calculate GAT times. You may need this function when you want to apply an offset to a Time Reference and have orders activated automatically during the day without having to be online.

function TimeNumToSecondNumTimeNumber )
{
Seconds int(TimeNumber%100);
Minutes int(TimeNumber/100%100);
Hours int(TimeNumber/10000%100);
NumberSecs int(3600*Hours+60*Minutes+Seconds);
return NumberSecs;
function SecondNumToTimeNumSecondNum )
{
Hours int(SecondNum /3600);
Minutes int((SecondNum -Hours*3600)/60);
Seconds int((SecondNum -Hours*3600)-Minutes*60);
TimeNumber Hours*10000 Minutes*100 Seconds;
return TimeNumber;
}
function ApplyOffsetToTimeNumRefTimeNumberOffset )
{
OffsetSecondNum TimeNumToSecondNumRefTimeNumber ) + Offset;
OffsetTimeNumber SecondNumToTimeNumOffsetSecondNum );
return OffsetTimeNumber;
}
OffSet Param("Offset in Seconds",0,-100,100,1);
RefTimeNum ParamTime("ReferenceTime",Now(2));
CalcTimeNum ApplyOffsetToTimeNumRefTimeNumOffset );
Title ="\n"+
" Reference Time: "+StrRight(NumToStr(DateTimeConvert2DateNum(), RefTimeNum),formatDateTime),11)+"\n"+
"Calculated Time: "+StrRight(NumToStr(DateTimeConvert2DateNum(), CalcTimeNum ),formatDateTime),11)+"\n";

Edited by Al Venosa.

Date Calculations (v2)

In Real-Time trading, you may need to perform date calculations that are referenced to your computer date instead of to the DateNumber of your data. Instead of struggling with years, dates, and months, it is much easier to use a linear data system like Rata Die, which simply counts the number of days since December 31 of the year zero. To use the Rata Die method you only need two conversion functions to convert between the Rata Die to DateNumbers and vise versa. In this post the Rata Die system will be used to calculate NASDAQ non-trading days and to calculate the date of the previous trading day.

The conversion functions listed below were posted on the AmiBroker User list by Paul Ho (thanks Paul!) and will be used the perform the needed calculations in this post.

NASDAQ non-trading days are copied from the NASDAQ website, converted to DateNumbers, and entered into the code using a ParamStr() function so that they can be changed annually without digging in the code. Here is typical listing for 2007:

NASDAQ Holiday Trading Schedule
2007 Dates – Unless noted, the following dates are holidays on which The NASDAQ Stock Market is closed:
January 1 – New Year’s Day
January 15 – Martin Luther King Jr.’s Birthday
February 19 – Presidents’ Day
April 6 – Good Friday
May 28 – Memorial Day
July 4 – Independence Day
September 3 – Labor Day
November 22 – Thanksgiving Day
December 25 – Christmas Day

To find the previous trading date, the code starts by using the previous Rata Die date, and if that isn’t a trading date, it decrements the Rata Die number until a trading day is found. Selected variables are output to the Chart Title so that you can vary the date using the ParamDate() and see haw the conversions work..

function DateNumberToRataDie( DateNumber )
{
num = DateNumber/10000;
yyyy = int(num) + 1900;
num = frac(num) * 100;
mm = int(num);
dd = frac(num)*100;
yyyy = yyyy + int((mm-14)/12);
mm = IIf(mm < 3, mm+12, mm);
RataDieNum = round(dd + int((153*mm-457)/5) + 365*yyyy + int(yyyy/4) - int(yyyy/100) + int(yyyy/400) - 306);
return (RataDieNum);
}

function RataDieToDateNumber(RataDieNum)
{
z = RataDieNum + 306;
g = z - 0.25;
a = int(G/36524.25);
b = a - int(A/4);
yr = int((b + g)/365.25);
Cc = b + z - int(365.25 * yr);
mm = int((5 * Cc + 456)/153);
dd = Cc - int((153*mm-457)/5);
yr = IIf(mm > 12, yr + 1, yr);
mm = IIf(mm > 12, mm - 12, mm);
dn = (yr-1900)*10000+mm*100+dd;
return dn;
}

function NoTradingDay( RataDieNum )
{
global DN, NasdaqNTDN;
DN = RataDieToDateNumber(RataDieNum );
DnStr = NumToStr(DN,1.0,False);
DW = RataDieNum%7;
return DW == 0 OR DW == 6 OR StrFind( NasdaqNTDN, DNStr);
}

NasdaqNTDN = "1070101,1070115,1070219,1070406,1070528,1070704,1070903,1071122,1071225";
weekdays = "Sunday,Monday,Tuesday,Wednesday,Thursday,Friday,Saturday";
DN1 = ParamDate("Date","05/07/2007");
RD1 = DateNumberToRataDie(DN1);
DW1 = RD1%7;
RD2 = RD1-1;
DN2 = RataDieToDateNumber(RD2);
DW2 = RD2%7;
while( NoTradingDay( RD2 ) )
{
RD2--;
DN2 = RataDieToDateNumber(RD2);
DW2 = RD2%7;
}
Title = "\n"+
"CURRENT TRADING DAY:\n\n"+
" Date: "+NumToStr(DateTimeConvert( 2, DN1),formatDateTime)+" "+StrExtract(Weekdays,DW1)+"\n"+
" Day Number: "+NumToStr(DW1,1.0)+"\n"+
" Rata Die: "+NumToStr(RD1,1.0,False)+"\n"+
WriteIf(NoTradingDay( RD1 ),"This is Not a Trading Day","This is a Trading Day")+"\n\n\n"+
"PREVIOUS TRADING DAY:\n\n"+
" Prev TDay: "+NumToStr(DateTimeConvert( 2, DN2),formatDateTime)+" "+StrExtract(Weekdays,DW2)+"\n"+
" Day Number: "+NumToStr(RD2%7,1.0)+"\n"+
" Rata Die: "+NumToStr(RD2,1.0,False)+"\n"+
WriteIf(NoTradingDay( RD2 ),"This is Not a Trading Day", "This is a Trading Day");

Edited by Al Venosa

Introduction to Real-Time AFL Programming

The AFL examples presented in this Category offer quick-start solutions to help get beginners on their way to Real-Time AFL programming. Topics will include measuring time, executing delays, collecting real-time data, scanning stocks, collecting order status, detecting errors, displaying system and portfolio status, etc. Most of the code may be related to fast automated trading, but much of it can also be used in other forms of trading.

They are not intended to replace or be a substitute for official AmiBroker documentation such as the AFL Reference, ReadMe files in your AmiBroker Folder, Knowledge Base, AFL Library, official Video Tutorials, and other Support material.

The objective is to create a resource of basic examples that introduce you to AFL programming techniques that you can easily modify to meet your personal needs. If you are a beginner or even if you are an ardent system developer, a well-organized resource like this can save you many hours of programming and make system development a lot more fun.

If you like to use Drag and Drop, you can create a #AFL Solutions folder (the “#” is added to force this folder to the top of your tree) in your C:\Program Files\AmiBroker\Formulas folder using the Windows Explorer. When you return to AmiBroker, you need to click View -> Refresh All to make the new folder visible. Inside the #AFL Solutions folder you can create sub folders to meet your specific requirements.

If you discover a useful AFL solution, you should copy it to the appropriate sub-folder of your #AFL Solutions folder. This will give you an impressive coding resource in just a few short weeks. A typical layout might look like this:

snag-0774.jpg


If you adopt standard-naming conventions for your variables, many of your code modules will work together without too many changes. Eventually you’ll be able to build trading systems in minutes instead of hours, simply by Dragging-and-Dropping code modules into an Indicator or perhaps by using the AFL Code Wizard.

Edited by Al Venosa.

Resetting Indicators

Smoothing Indicators like MA(), EMA(), T3(), DEMA(), etc. are intended to give you an average indication of price movements. They do this by filtering out high frequency changes in a particular price variable. The problem is that such indicators introduce time lag into the system. Indicator lag is most readily apparent when the overall price chart is relatively smooth (for example, when a simple MA() stays within the High-Low range), and suddenly the price shifts or gaps. When this happens, most smoothing indicators need many bars to overcome the influence of these gaps and re-position themselves back within the average price range of the bar.

Although all trading systems depend on lag to know that something has changed, the degree of lag needed by a system varies. Resettable indicators are most useful in systems that require a smoothing function that closely follows the price, i.e., one that exhibits a minimum of lag.

When a Resettable Indicator encounters a sudden larger-than-normal offset to the average price, it changes behavior and resets the Indicator to a calculated reference point. While there are other patterns or conditions (Signals, Stops, Targets, etc.) in which you might want to reset an Indicator, this discussion focuses on simple gaps that are defined by the AFL functions GapUp() and GapDown(). The techniques introduced here work equally well with EOD or RT data. Another application of the concept would be in RT trading where you might want to reset your Indicator at the start of each new day or trading session.

The reset idea is based on the fact that smoothing functions have a primary period and that the Indicator’s lag will be proportional to that period, i.e. longer periods increase lag and shorter periods decrease lag. Knowing that, we can reset an Indicator by simply setting its period to a lower value. Typically, resetting to a period of 1 works fine. After the reset bar, the period is increased with each passing bar until it has reached its original value.

Consider the EOD example shown below. White bars identify the Gaps that trigger a reset.

snag-0773.jpg

At the first White bar the price gaps up and the Traditional T3 (Blue) falls behind immediately and actually moves opposite to the price. The Resettable T3 (Red) reset itself when it detected the gap and almost immediately is able to track the price bars in the right direction.

There are many ways to reset an indicator: you can do it abruptly by setting the period to 1; you can maintain a minimum smoothing by resetting it to 2 or 3; or you can gradually adjust period and/or T3-Sensitivity according to some formula. The example code below uses the T3 formula that can be found in the AmiBroker library.

In the example below, I use the start (1st bar) of the trading day to reset the T3. However, there are many other situations where you might want to reset an indicator. For example, when using trailing stops or SAR type exits, sometimes you might want to reset an indicator when you get a Buy or Sell signal. You can assign your own reset reference by averaging all bar prices, e.g., (O+H+L+C)/4. However, you should stay away from averaged values as they would reintroduce lag. I prefer the use of (O+C)/2, but you should try any number of other ideas that fit your liking.

function T3( Price, T3Periods, s )
{
e1 = AMA( Price, 2 / (T3Periods+1));
e2 = AMA( e1, 2 / (T3Periods+1));
e3 = AMA( e2, 2 / (T3Periods+1));
e4 = AMA( e3, 2 / (T3Periods+1));
e5 = AMA( e4, 2 / (T3Periods+1));
e6 = AMA( e5, 2 / (T3Periods+1));
C1 = -s^3;
C2 = 3*s^2*(1+s);
C3 = -3*s*(s+1)^2;
C4 = (1+s)^3;
T3Result= c1*e6+c2*e5+c3*e4+c4*e3;
return T3Result;
}


function T3r( C, T3Sensitivity, T3Periods, ResetReference )
{
global Reset;
CPrice = IIf(Reset, ResetReference, C );
T3Periods = Min( T3Periods, BarsSince(Reset));
T3Periods = IIf(Reset,1, T3Periods );
s = T3Sensitivity;
e1 = AMA( CPrice, 2 / (T3Periods+1));
e2 = AMA( e1, 2 / (T3Periods+1));
e3 = AMA( e2, 2 / (T3Periods+1));
e4 = AMA( e3, 2 / (T3Periods+1));
e5 = AMA( e4, 2 / (T3Periods+1));
e6 = AMA( e5, 2 / (T3Periods+1));
C1 = -s^3;
C2 = 3*s^2*(1+s);
C3 = -3*s*(s+1)^2;
C4 = (1+s)^3;
T3Result= c1*e6+c2*e5+c3*e4+c4*e3;
return T3Result;
}

T3Sensitivity = Param("T3 Sensitivity",1,0.1,5,0.01);
T3Periods = Param("T3 Periods",3,1,10,1);
Reset = GapUp() OR GapDown();
ResetReference = (H+L+C)/3;
T3rPlot = T3r( C, T3Sensitivity, T3Periods, ResetReference );
Plot(C,"\nClose",IIf(Reset,2,1),128);
Plot(T3rPlot,"\nResetable T3",4,1|styleThick);
Plot(T3( C, T3Periods, T3Sensitivity),"\nTraditional T3",6,1|styleThick);

Edited by Al Venosa

Session Timing

True System Automation means you program your trading system to start and stop at designated times while you go play golf, right?

This means that in addition to having a Master Enable/Disable switch you need to automate the start and stop of your trading session. For example, you might want to start your session at 9:30 AM and have it automatically end at 4:00 PM.

The code below uses the ParamDate() and ParamTime() to set the session start and stop dates/times, and compares these parameters to the system Date and Time that are returned by the Now() function. It generates various session-states that are displayed in the Title, when you incorporate this code into your system you will use these states to perform specific actions, like Close all Positions, Cancel all Orders, etc. The BlinkText() is not really needed but was thrown in for fun.

function BlinkTextText )
{
ABAxisColor colorWhite;
if( Status("redrawaction") )
{
BlinkStateStaticVarGet("BlinkState");
if( IsNullBlinkState) ) StaticVarSet("BlinkState"False);
if( BlinkState )
{
Text EncodeColor(colorBrightGreen)+Text+EncodeColor(ABAxisColor);
StaticVarSet("BlinkState"False);
}
else
{
Text EncodeColor(ABAxisColor)+Text;
StaticVarSet("BlinkState"True);
}
}
return Text;
}
RequestTimedRefresh);
DisableSessionTiming ParamToggle("Auto Session Timing","ENABLED|DISABLED",1);
ParamDateNumber  ParamDate("Date"Now(1), 0);
ParamStartTime   ParamTime("Start","09:30:00");
ParamEndTime   ParamTime("End","15:59:00");
RTTimeNumber  Now(4);
RTDateNumber  Now(3);
InSessionDate  RTDateNumber == ParamDateNumber;
PreSessionTime  RTTimeNumber &ltParamStartTime;
PostSessionTime  RTTimeNumber &gtParamEndTime;
InSessionTime  NOT PreSessionTime OR PostSessionTime );
PrevInSession   StaticVarGet("InSession");
if( DisableSessionTiming )  InSession 1;
else     InSession InSessionDate AND InSessionTime;
StartSessionTrigger LastValue(InSession) &gtPrevInSession;
EndSessionTrigger LastValue(InSession) &ltPrevInSession;
StaticVarSet("InSession"InSession);
OutOfSessionColor  ParamColor("Out of Session",colorBlack);
PlotNOT InSession,"",colorBlack,styleArea|styleOwnScale|styleNoLabel,0,1);
Title "\n"+BlinkTextNow(0) )+"\n"+
"Session Status: "+
WriteIfDisableSessionTiming"Session Timing Disabled",
WriteIfNOT InSessionDate,"Out of Session date, ","")+
WriteIf(PreSessionTime AND InSessionDate,"Waiting for Start, ","")+
WriteIf(StartSessionTrigger"Start Trigger, ","")+
WriteIf(InSessionTime"In Progress, ","")+
WriteIf(EndSessionTrigger"End Trigger, ","")+
WriteIf(PostSessionTime"Completed",""));

Edited by Al Venosa

Pane and Window Execution order

Few users pay attention to the order in which tasks performed in the various Amibroker panes and Windows are executed. The order of pane-executions can have a major impact on the performance of a fast, Real-Time trading system. It is easy to assume that the pane-formulas execute top down, but they don’t. In fact, the order of execution is unpredictable and should, for all practical purposes, be considered Random by the user.

For example, when using Static or Persistent Variables, if you initialize a StaticVariable in the top pane for use in the lower pane, you want the top pane to execute first so that the newly assigned value can be used immediately, i.e., during the same refresh in the lower pane and not at the next Chart Refresh, which may happen a second or more later.

Now consider that the lower pane executes first. In this case, it would require waiting either until the next quote or, if you use the function RequestTimedRefresh(1), the next second (whichever comes first). In this case, the Static Variable would contain a value from the previous Refresh, which means the value of the Static Variable would lag by one Chart refresh. If the formula in the lower pane is placing orders with LMT prices based on the last quote (the one that triggered the refresh) and since the LMT price was calculated in the top pane during the previous Refresh, the LMT price used would be based on the previous and not the last quote. In most cases, this would decrease your probability of a LMT fill.

An obvious solution is both to append your ordering code to the code that initializes your Static variable and to execute in the same pane. However, this may be difficult to do if your formulas are long, or if each formula generates charts with different scales and/or incompatible Titles. Even so, if you decide to solve the problem this way, you should consider using #include files.

Another solution is to force a RefreshALL at the end of your initializing formula. This will refresh all panes without delay, but now some panes may be executed more than once for each Chart Refresh. You will have to decide if this is significant in your system. The following two lines can be appended to your code and will force a RefreshAll. Be aware that the minimum RefreshAll interval is one second, so if your quotes arrive faster, this may not work very well.

oAB = CreateObject("Broker.Application");
oAB.RefreshAll();

If order of execution is critical, you can make the RefreshAll() conditional on the count of a pane-counter and only force a RefreshAll if the pane execution order demands it. To find the pane execution order, you can add a pane execution counter to all pane formulas and log the count to DebugView. If the count is lower in, say, the upper pane compared to the lower, that means it was executed in the upper pane earlier. If the count is greater, it was executed later than the lower pane.

To be able to identify the formula being executed in your log, place the formula name at the very top of your formula:

Filename = StrLeft(_DEFAULT_NAME(),StrLen(_DEFAULT_NAME())-2);

To add the counter you append the following code to the very end of your formula:

PaneCounter = Nz(StaticVarGet("PaneCounter"));
StaticVarSet("PaneCounter",PaneCounter+1);
CounterDisplayLine = Filename +", ChartID: "+GetChartID()+", PaneCounter: "+NumToStr( PaneCounter,1.0,False);
_TRACE( "# "+CounterDisplayLine );

This will show the order and time of execution, in seconds, in the DebugView window:

snag-0770.jpg

You can study/analyze pane execution order without disturbing your code by Inserting the 4-line code below multiple times in the same window, thus creating multiple panes. Then change the order of panes using the small arrows in the menu that pops up when you hover your mouse pointer over the top right corner of the pane. In this example the pane order is shown in the Chart Title.

Filename = StrLeft(_DEFAULT_NAME(),StrLen(_DEFAULT_NAME())-2);
PaneCounter = Nz(StaticVarGet("PaneCounter"));
StaticVarSet("PaneCounter",PaneCounter+1);
Title = Filename +", PaneCounter: "+NumToStr( PaneCounter,1.0,False);

snag-0771.jpg

The above capture shows that the execution order is not top down. You may observe that, in your case, the execution order tracks the ChartID. This is because the panes were inserted in sequence one after another, but this would not normally be the case.

While this topic may not be important to everyone, it will become critical when you start tinkering with High-Frequency trading systems.

Edited by Al Venosa

Persistent Variables (v3)

Static Variables retain their values as long as AmiBroker is running. If you shut down AmiBroker or experience a computer crash, your Static Variables lose their values. This can create serious problems in Automated Trading. For example, suppose you experience a computer crash while you have many pending orders. After restarting everything, you are unable to modify the orders, and so you are forced to use the TWS to manually clean up the mess and restart.

To prevent this situation, you can use Persistent variables that store their values on your Hard Disk. They will remain there until you delete them. Using Persistent variables, if you experience a crash or shut down your system during the night, the persistent variables will automatically be reloaded when you power up again.

Persistent variables can also be used to save ticker-specific system parameters. For example, you could run an optimization and save the optimized parameters in a Persistent Variable encoded with the Ticker’s name. Below are examples for saving text and numerical values. Arrays are not included here because arrays are better handled in other ways. Included in the code below is a handy function to create Persistent lists and to remove items from these lists. The list functions are useful when you wish to save lists of Symbols and/or OrderIDs dynamically.

Note that these parameters must be stored in a specific folder on your Hard Disk (see first code line below for an example of a typical recommended path). You must assign the desired location to the string variable PersistentPath. Remember that Persistent variables are Global just like Static variables, and their names may have to be encoded with ChartIDs and/or Symbol names to prevent them from being modified by different programs.

PersistentPath = "C:\\Program Files\\AmiBroker\\PersistentVariables\\";

function PersistentVarSetText( VarName, String )
{
global PersistentPath;
fh = fopen( PersistentPath+VarName+".pva","w" );
if( fh )
{
fputs( String, fh );
fclose( fh );
}
return fh;
}

function PersistentVarGetText( VarName )
{
global PersistentPath;
fh = fopen( PersistentPath+VarName+".pva","r" );
if( fh )
{
String = fgets( fh );
fclose( fh );
}
else string = "";
return String;
}

function PersistentVarSet( VarName, Number )
{
global PersistentPath;
String = NumToStr(Number);
fh = fopen( PersistentPath+VarName+".pva","w" );
if( fh )
{
fputs( String, fh );
fclose( fh );
}
return fh;
}


function PersistentVarGet( VarName )
{
global PersistentPath;
fh = fopen( PersistentPath+VarName+".pva","r" );
if( fh )
{
String = fgets( fh );
fclose( fh );
Number = StrToNum(String);
}
else Number = Null;
return Number;
}

function PersistentListAdd( VarName, String )
{
SubStrExists = 0;
if( String != "" )
{
List = PersistentVarGetText( VarName );
for( i=0; ( LoopItem = StrExtract( List, i ) ) != ""; i++ )
{
if( LoopItem == String ) SubStrExists = 1;
}
if( NOT SubStrExists )
{
List = List + String+",";
PersistentVarSetText( VarName, List );
}
}
Return List;
}

function PersistentListRemove( VarName, String )
{
if( String != "" )
{
List = PersistentVarGetText( VarName );
NewList = "";
for( i=0; ( LoopItem = StrExtract( List, i ) ) != ""; i++ )
{
if( LoopItem != String ) NewList = NewList + LoopItem +",";
}
PersistentVarSetText( VarName, NewList );
}
Return NewList;
}

function PersistentVarAddLineVarNameLine )
{
    global PersistentPath;
    fh 0;
    if ( Line != "" )
    {
        fh fopenPersistentPath VarName ".pva""a" );
        if ( fh )
        {
            fputsLine "\n"fh );
            fclosefh );
        }
    }
    return fh;
}

// Here is an example on how to export lines from an Exploration
// Look for the file in at the path defined at the top of this post
Filter Status"LastBarInTest" );
AddColumnC"C"1.2 );
ToFile Name() + "," NumToStrLastValue), 1.2 );
PersistentVarAddLine"MyData"ToFile );

The following function was kindly contributed by suresh (see comment) and can be used to delete Persistent variables:

function PersistentVarRemoveVarName )
{
global PersistentPath;
Fn=PersistentPath VarName ".pva";
fh=fdeleteFn ) ;
return fh;
}

Edited by Al Venosa

Removing Static Variables

Trading systems may use hundreds or even thousands of Static Variables, and the associated memory usage will eventually slow down your system. To prevent this you need to clear them whenever possible. Since at this time AmiBroker doesn’t have a function to remove all Static Variables from memory, you can remove them by referencing each of them by their name, i.e. StaticVarRemove( StaticVarName ).

Using an indexed name will allow you to use a loop to remove Static Variables from memory. For example, a naming convention such as BuyPrice+ NumToStr(n,1.0,false), where n could be the DateNum(), TimeNum(), DateTime(), BarIndex(), etc., would allow you to use a simple loop to generate all possible names and remove those that return non-null values.

Below are two examples of how to remove StaticVariables with this technique. Be careful when using BarNum() because the bar number changes if you use SetBarsRequired(), or if you use Quick-AFL, or if your data exceed the amount set in your DataBase settings or in Preferences.

procedure ClearAllTrades()
{
for( T=0; T<=BarCount; T++)
{
TradeNumStr = NumToStr(T,1.0,False);
TradeName = "Trade"+TradeNumStr;
StaticVarRemove( TradeName );
}
}

Here is an example of how to remove from memory Ticker-specific OrderIDs that were, for example, used in a portfolio trading system:

procedure RemoveBasketIDs()
{
global TradingBasket;
for( NT=0; ( Ticker = StrExtract( TradingBasket, NT ) ) != ""; NT++ )
{
StaticVarRemove(Ticker+"-OID");
StaticVarRemove(Ticker+"-Action");
StaticVarRemove(Ticker+"-Qty");
}
}

Edited by Al Venosa

« Previous PageNext Page »